
Not much to like here. But will big-money investors jump aboard?
By David Enna, Tipswatch.com
First, let me get this off my chest: I’m not a fan of 30-year Treasury Inflation-Protected Securities. The long term is beyond my likely lifespan, and my investment style is to buy and hold TIPS to maturity.
A 30-year TIPS is a very volatile investment, and that can make it appealing to a gutsy bond trader. But even then, I think you’d need nerves of steel to jump aboard the Treasury’s reopening auction Thursday of a 30-year TIPS, CUSIP 912810SV1, even as we seem to be nearing an end to the Federal Reserve’s aggressive bond-buying stimulus.
Then again, with 30-year real yields at a record low, every single 30-year TIPS ever auctioned is now worth more than the original auction price. Traders, rejoice. Then … sell?
(I do hold two previous 30-year TIPS from long-ago auctions. CUSIP 912810FH6 with a coupon rate of 3.875%, maturing in April 2029, and CUSIP 912810QP6 with a coupon rate of 2.125%, maturing in February 2041. Those are my treasured little babies, and I’m not selling.)
What to expect
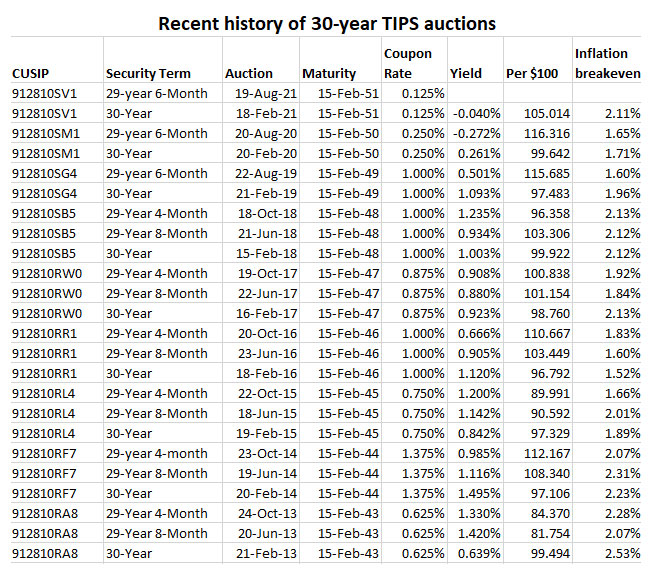
The Treasury is offering $8 billion of this 29-year, 6-months TIPS. It originated in an auction Feb. 18, 2021, with a real yield to maturity of -0.04%, just barely negative to future inflation. Its coupon rate was set at 0.125% and investors paid an adjusted price of about $105.01 for about $100.08 of value, after accrued interest and inflation were added in. That result ended up looking good for investors because the real yield came in at least 10 basis points higher than expected.
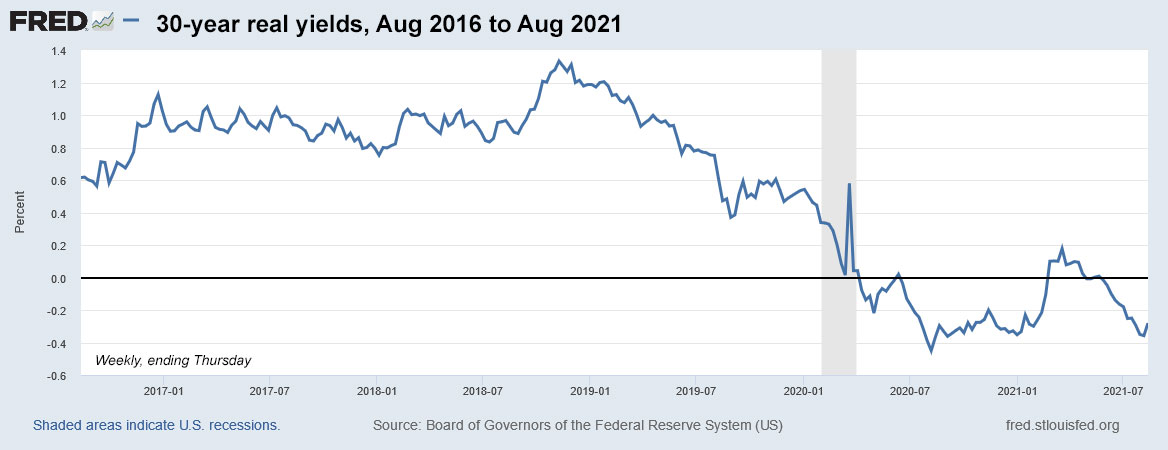
Now, six months later, you can track this TIPS on Bloomberg’s Current Yields page. It closed Friday with a real yield of -0.32% and a price of about $113.69. If that yield holds through Thursday’s auction, it would be the lowest ever for a TIPS auction of this term. The previous low of -0.272% was set a year ago, Aug. 20, 2020. Only two 29- to 30-year TIPS auctions have ever resulted in a negative real yield. Thursday’s auction will be the third.
The premium price is so high because of the spread between the coupon rate of 0.125% and the real yield of -0.32%. And it shows how the ultra-long maturity magnifies the risk (and possible gain) of a 30-year TIPS.
CUSIP 912810SV1 will carry an index ratio of 1.04326 on the settlement date of Aug. 31, meaning that investors will pay an adjusted price about 4.3% more than the purchase price, but receive a matching amount of additional principal. As a rough estimate, an investor seeking $10,000 of this TIPS could end up paying $11,700 for about $10,432 of value. Ouch.
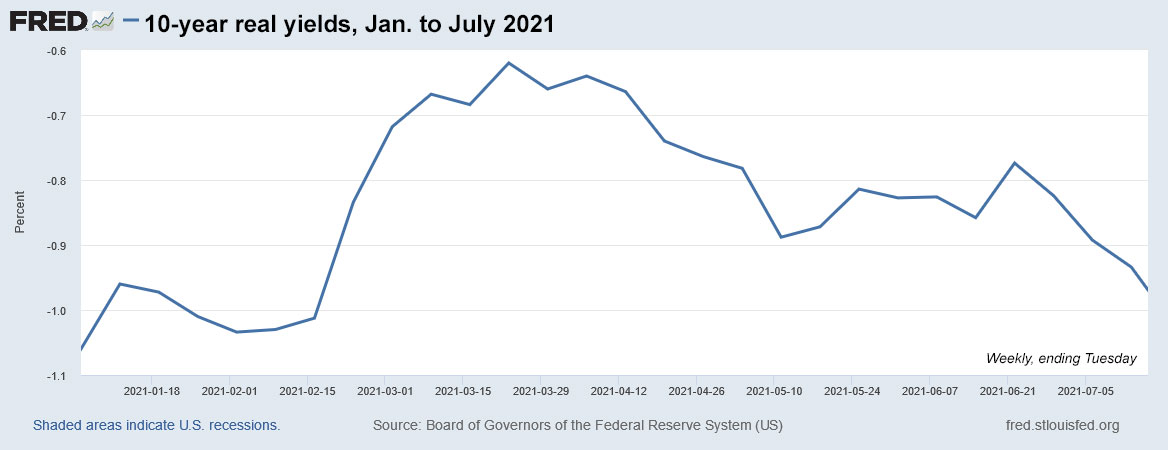
Here is the trend in 30-year real yields over the last five years, showing the quick decline below zero as the Federal Reserve began aggressive bond-buying in March 2020. Although the real yield popped above zero from February to March 2021, it has again settled into a deeply negative range:
Inflation breakeven rate
With a 30-year nominal Treasury bond yielding 1.93%, this TIPS currently has an inflation breakeven rate of 2.25%, a bit high by historic trends but a reasonable number. Here is the trend in the 30-year inflation breakeven rate over the last five years:
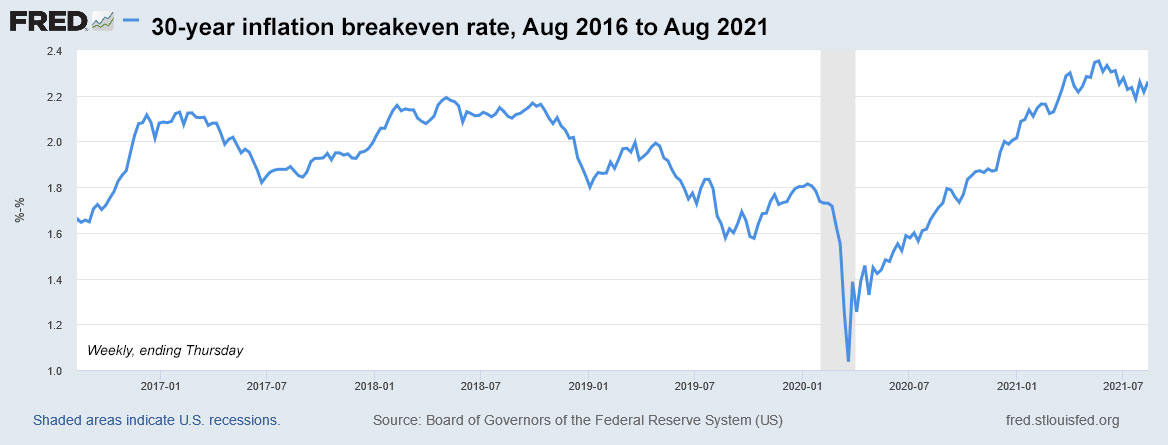
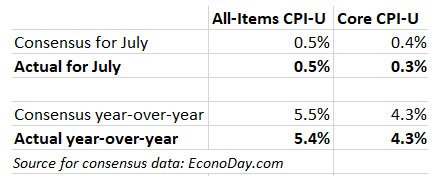
The one remarkable thing about this chart is the massive surge higher after both Congress and the Federal Reserve launched aggressive economic stimulus programs in March 2020. Those measures have ignited inflation, as reflected by the current annual rate of 5.4%. The breakeven rate of 2.25% isn’t wildly out of normal. U.S. inflation over the last 30 years has averaged 2.3%, the lowest for any 30-year period beginning with 1971. So a breakeven rate of 2.25% looks entirely reasonable.
Final thoughts
I’m not going to be an investor in this TIPS. No secret there. Will big-money investors — the usual market for a 30-year TIPS — be enthusiastic buyers? I’m doubting that. A record-low real yield on a volatile long-term investment isn’t very appealing, especially as the Federal Reserve appears just months away from slowing down its bond buying. On the other hand, the inflation breakeven rate of 2.25% makes this TIPS a bit more appealing than a nominal 30-year Treasury.
I think we could see some surprises at this week’s auction. Could the real yield jump a bit higher, as it did in January’s weak auction? We’ll see. I’ll be on the road this week but will try to post the auction results as soon as possible after the 1 p.m. EDT close.
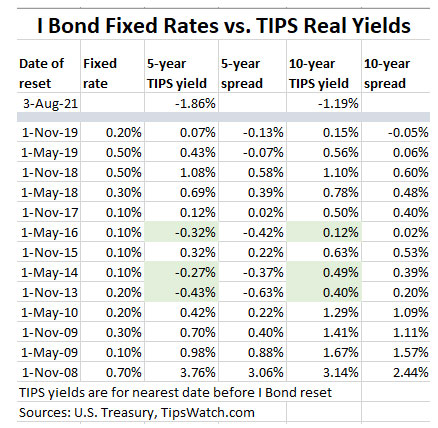
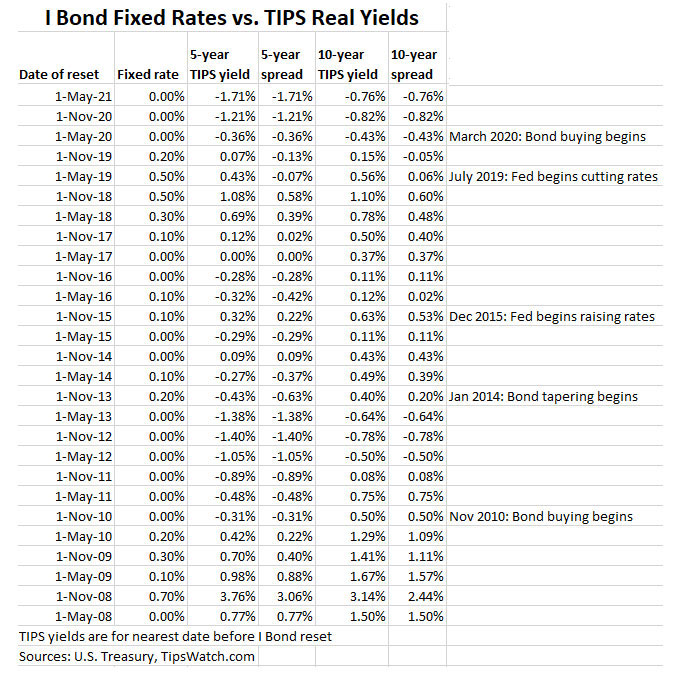
Meanwhile, here’s a history of recent 29- to 30-year TIPS auctions, showing how rare it is to have a 30-year TIPS with a negative real yield and a coupon rate of 0.125%:
* * *
David Enna is a financial journalist, not a financial adviser. He is not selling or profiting from any investment discussed. The investments he discusses can purchased through the Treasury or other providers without fees, commissions or carrying charges. Please do your own research before investing.


Real and nominal yields tend to move together, higher or lower. In the same direction, but not necessarily by the…