The I Bond exit ramp is now open; proceed with caution

Time redemptions to take full advantage of the recent 6.48% variable rate.

By David Enna, Tipswatch.com

First off, before I start talking about redeeming investments in U.S. Series I Savings Bonds, let’s take a moment to ponder just how worthwhile I Bonds have been as an investment over the last several years.

Back in late 2020, before U.S. inflation started surging, I Bonds had a six-month composite rate of 1.68%. That might not sound exciting, but at the time a 13-week T-bill was paying 0.11% and a 10-year Treasury note, 0.68%. The I Bond’s fixed rate of 0.0% was a whopping 83 basis points higher than the negative real yield of a 10-year TIPS.

And then, when inflation began surging into early 2022, the I Bond got a sensational six-month variable rate of 9.62%, towering over the yields of a 13-week Treasury bill (0.85%) and 10-year Treasury note (2.89%).

Through the dire period of pandemic-induced ultra-low interest rates, I Bonds delivered solid returns, tracking U.S. inflation as it soared higher. Investor demand also soared, causing the TreasuryDirect site to crash in October 2022 as the 9.62% rate was about to expire.

In my opinion, I Bonds remain a worthwhile, simple-to-track long-term investment, ensuring your savings will grow tax-deferred with future inflation. But if your investment timeline is shorter-term, you may want to shift money into Treasury bills, where the nominal returns are now 100+ basis points higher. Even if you are investing longer-term, you may want to look at Treasury Inflation-Protected Securities, where real yields are now 70+ basis points higher than the I Bond’s current fixed rate of 0.9%.

I know there are a lot of investors who jumped into I Bonds in October 2022 to get the 9.62% variable rate for six months, followed up by 6.48% for six months. That was a smart move. But now, those I Bonds (which have a fixed rate of 0.0%) are transitioning to a variable rate of 3.38%, well below the market for nominal Treasurys.

Create a strategy

Redeeming I Bonds is a tricky transaction, because an I Bond must be held for 12 full months and then there is a 3-month interest penalty on I Bonds held less than 5 years. Get this wrong and you could lose 3 months of 6.48% interest, or more. For those I Bonds, the best strategy is wait a full 3 months after the 6.48% rate has completed, then redeem early in the next month. That way the penalty will apply to the 3.38% rate.

Here is a guide to the optimal redemption dates for I Bonds purchased since October 2021:

If you bought in October 2021

Your I Bond has a fixed rate of 0.0% and is a candidate for redemption.

  • It earned 3.54% (annualized) from October 2021 to March 2022
  • 7.12% from April to September 2022
  • 9.62% from October 2022 to March 2023
  • 6.48% from April to September 2023
  • 3.38% from October 2023 to March 2024.
  • Optimal redemption date: Jan. 1, 2024.

If held until April 1, 2024, this I Bond will have earned an average annual return of 6.01%.

If you bought in November 2021

Your I Bond has a fixed rate of 0.0% and is a candidate for redemption.

  • It earned 7.12% (annualized) from November 2021 to April 2022.
  • 9.62% from May to October 2022.
  • 6.48% from November 2022 to April 2023
  • 3.38% from May to October 2023
  • Optimal redemption date: Aug. 1, 2023

If held until Nov. 1, 2023, this I Bond will have earned an average annual return of 6.64%.

Purchase in December 2021: Optimal redemption date is Sept. 1, 2023.

Purchase in January 2022: Optimal redemption date is Oct. 1, 2023.

Purchase in February 2022: Optimal redemption date is Nov. 1, 2023.

Purchase in March 2022: Optimal redemption date is Dec. 1, 2023.

Purchase in April 2022: Optimal redemption date is Jan. 1, 2024.

If you bought in May 2022

Your I Bond has a fixed rate of 0.0% and is a candidate for redemption.

  • It earned 9.62% (annualized) from May to October 2022.
  • 6.48% from November 2022 to April 2023
  • 3.38% from May to October 2023
  • Optimal redemption date: Aug. 1, 2023

If held through Nov. 1, 2023, this I Bond will have earned an annual average return of 6.48%.

Purchase in June 2022: Optimal redemption date is Sept. 1, 2023.

Purchase in July 2022: Optimal redemption date is Oct. 1, 2023.

Purchase in August 2022: Optimal redemption date is Nov. 1 2023.

Purchase in September 2022: Optimal redemption date is Dec. 1, 2023.

Purchase in October 2022: Optimal redemption date is Jan. 1, 2024.

If you bought in November 2022

Your I Bond has a fixed rate of 0.4% and is not a good candidate for redemption if you are holding any other I Bonds with a fixed rate of 0.0%. Redeem those first. For this next series I am using the term “potential” redemption dates instead of “optimal” because the 0.4% fixed rate makes these attractive long-term holdings.

In addition, all I Bonds must be held for 12 months before they can be redeemed. For this series, your future redemption decision may depend on the I Bond’s new variable rate, which will be reset on Nov. 1, 2023.

  • It earned 6.89% from November 2022 to April 2023.
  • 3.79% from May to November 2023.
  • Potential redemption date: Cannot be redeemed until Nov. 1, 2023.

If held through Nov. 1, 2023, this I Bond will have earned an average annual return of 5.33%.

Purchase in December 2022: Potential redemption date is Dec. 1, 2023.

Purchase in January 2023: Potential redemption date is Jan. 1, 2024.

Purchase in February 2023: Potential redemption date is Feb. 1, 2024.

Purchase in March 2023: Potential redemption date is March 1, 2024.

Purchase in April 2023: Potential redemption date is April 1, 2024.

If you bought in May 2023

Your I Bond has a fixed rate of 0.9% and it is not a candidate for redemption. This is an excellent long-term holding. If you need the money and have any other I Bonds with a fixed rate of 0.0%, redeem those first.

In addition, all I Bonds must be held for 12 months before they can be redeemed. For this series, your future redemption decision may depend on the I Bond’s new variable rate, which will be reset on Nov. 1, 2023.

  • It is earning 4.3% from May to October 2023.
  • The variable rate will reset on Nov. 1, but the fixed rate will remain at 0.9%.

Purchase in June 2023. Potential redemption date is June 1, 2024.

Purchase in July 2023. Potential redemption date is July 1, 2024.

Purchase in August 2023. Potential redemption date is Aug. 1, 2024.

Understanding the pattern

The optimal redemption pattern is consistent for all I Bonds, no matter the year they were purchased. If you bought an I Bond any time within the last 5 years, here are the current ideal times to consider redemptions to minimize the three-month interest penalty:

  • January: After Oct. 1, 2023
  • February: After Nov 1, 2023
  • March: After Dec. 1, 2023
  • April: After Jan. 1, 2024
  • May: After Aug. 1, 2023
  • June: After Sept. 1, 2023
  • July: After Oct. 1, 2023
  • August: After Nov. 1, 2023
  • September: After Dec. 1, 2023
  • October: After Jan. 1, 2024.
  • November: After Aug. 1, 2023
  • December: After Sept. 1, 2023

Here is a chart I created for an article in November 2022 that demonstrates why the optimal redemption dates fall back six months for I Bonds purchased in May and November, when the new six-month variable rate is reset:

Click on image for larger version.

What about older I Bonds?

You may want to redeem older I Bonds, held more than 5 years with fixed rates of 0.0%. Of course, there will be no redemption penalty, so you simply want to make sure to complete the full six months of the 6.48% annualized variable rate, and then redeem early the next month. (You earn no interest on an I Bond you didn’t hold through the last day of a month.)

For example, let’s look at purchases for each month of 2017 (the same pattern would hold for other years, but make sure the I Bond truly has a fixed rate of 0.0% before you redeem). Some months are ready to redeem right now, but for some others you will want to wait to complete the 6.48% rate.

  • Purchased January 2017. Redeem July 1, 2023.
  • February 2017. Aug. 1, 2023.
  • March 2017. Sept. 1, 2023.
  • April 2017. Oct. 1, 2023.
  • May 2017. May 1, 2023.
  • June 2017. June 1, 2023.
  • July 2017. July 1, 2023.
  • August 2017. Aug. 1, 2023.
  • September 2017. Sept. 1, 2023.
  • October 2017. Oct. 1, 2023.
  • November 2017. May 1, 2023.
  • December 2017. June 1, 2023.

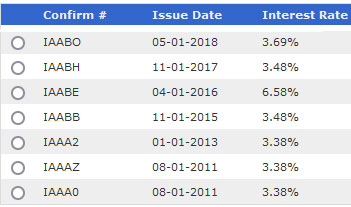
One caution: When you go to redeem an I Bond in TreasuryDirect, finding the correct month-of-issue can be difficult. From your account’s opening page, click on the Series I Savings Bond radio button near the bottom of that page and click “submit.” Then you will see your “Current Holdings” and issue dates.

For an older I Bond — held more than 5 years — look for the I Bonds listed with an interest rate of 3.38% — the current variable rate combined with a 0.0% fixed rate. That older I Bond is safe to redeem.

In this example, the lower three I Bonds have a fixed rate of 0.0% and have transitioned to the 3.38% interest rate. Those can be priorities for redemption. The others all have a better fixed rate and one is still paying 6.58%. Those are not the ones to sell first.

A reminder about taxes

When you redeem any savings bond, you are taking money out of a tax-deferred investment and you will immediately owe federal income taxes on your interest earnings. If you are doing a large number of redemptions, you could climb into a higher tax bracket or potentially trigger Medicare IRMAA surcharges.

An example: Let’s say you want to redeem $10,000 in an 0.0% fixed rate I Bond issued in May 2017. As of August 1, that I Bond had a value of $12,400, so if you redeemed today that decision would create taxable income of $2,400. If you are in the 22% tax bracket, the federal income tax would be $528.

You can easily check the current value of any I Bond using TreasuryDirect’s Savings Bond Calculator (which will automatically subtract 3 months interest for I Bonds held less than five years) or at EyeBonds.info, an accurate and extremely useful resource for information on I Bonds and TIPS.

Final thoughts

I am not advocating selling out of I Bonds. These savings bonds remain a very safe way to push inflation-protected cash into the future.

But I also don’t see the need to hold I Bonds for 30 years. As you enter retirement years, it makes sense to consider redeeming I Bonds to supply cash when you need the money. Or, for people with a shorter-term view, to switch to a more attractive near-term investment like a 1-year T-bill. Or, to use proceeds from a 0.0% I Bond to roll into a new I Bond investment with a 0.9% fixed rate, possibly using the gift box strategy.

As you ponder redemptions, remember to first target I Bonds with 0.0% fixed rates. And for I Bonds held less than 5 years, wait until you’ve transitioned into the 3.38% interest rate for a full three months.

If you got this far … This article contains a lot of numbers, months and years, subtracting six months here and not there. If you spot any errors, post them in the comments area and I will thank you and make a fix.

I Bonds: A not-so-simple buying guide for 2023

Confused by I Bonds? Read my Q&A on I Bonds

Let’s ‘try’ to clarify how an I Bond’s interest is calculated

Inflation and I Bonds: Track the variable rate changes

I Bonds: Here’s a simple way to track current value

I Bond Manifesto: How this investment can work as an emergency fund

* * *

Feel free to post comments or questions below. If it is your first-ever comment, it will have to wait for moderation. After that, your comments will automatically appear. Please stay on topic and avoid political tirades.

David Enna is a financial journalist, not a financial adviser. He is not selling or profiting from any investment discussed. I Bonds and TIPS are not “get rich” investments; they are best used for capital preservation and inflation protection. They can be purchased through the Treasury or other providers without fees, commissions or carrying charges. Please do your own research before investing.

Posted in Cash alternatives, I Bond, Investing in TIPS, Savings Bond, Treasury Bills, TreasuryDirect | 150 Comments

Fitch downgrades U.S. debt and we should have seen it coming

By David Enna, Tipswatch.com

We got a surprise announcement yesterday that should surprise no one: Fitch Ratings downgraded the Issuer Default Rating on U.S. debt to ‘AA+’ from ‘AAA,’ with a stable outlook.

This follows by almost exactly 12 years a similar action by Standard & Poors, which downgraded U.S. debt to an AA+ rating on Aug. 6, 2011. S&P has never lifted that downgrade and still has U.S. debt rated as AA+.

The reason Tuesday’s announcement was a surprise is that it precedes a potential — and very likely — U.S. government crisis by two months. From a USA Today report:

Once lawmakers get back to Capitol Hill in mid-September, the House and Senate will be in session for roughly three weeks until the Sep. 30 deadline to pass a federal budget. On Oct. 1, a new fiscal year begins. If lawmakers cannot push through 11 out of 12 separate spending bills, after passing just one before the August recess, the country will face a government shutdown. …

“We should not fear a government shutdown,” Rep. Bob Good, R-Va., declared at an event outside the Capitol this week. “Most of the American people won’t even miss it if the government is shut down temporarily.”

There is little doubt a shutdown is coming. A number of Republicans are pushing for deeper spending cuts than they got in May’s debt-ceiling compromise. A factor that few people realize: The compromise includes language that enforces a 1% cut in federal spending if all 12 appropriations bills are not passed, and each bill must now get a separate vote (they’ve been grouped together in the past in “omnibus” spending bills). From a New York Times report:

The debt-limit agreement imposes an automatic 1 percent cut on all spending — including on military and veterans programs, which were exempted from the caps in the compromise bill — unless all dozen bills are passed and signed into law by the end of the calendar year. Mandatory spending on programs such as Medicare and Social Security would be exempt.

In essence, a few Republican House members could force BOTH a government shutdown and a 1% automatic spending cut, simply by failing to pass one of the 12 appropriations bills.

All this has been known for months, but it took the calendar turning to August for the fire to burn hot. Fitch Ratings saw the fire and acted.

Fitch’s reasoning

Fitch Ratings on Tuesday released a Rating Action Commentary that explains its reasoning. Here are key elements:

Ratings Downgrade: Fitch noted expected fiscal deterioration over the next three years, a high and growing U.S. debt burden, and the erosion of governance reflected in repeated debt limit standoffs and last-minute resolutions.

Erosion of governance. Fitch noted:

  • A steady deterioration in U.S. governing standards over the last 20 years.
  • Repeated debt-limit political standoffs and last-minute resolutions that have eroded confidence in fiscal management.
  • Economic shocks, tax cuts and new spending initiatives that have contributed to successive debt increases over the last decade.
  • Limited progress in tackling medium-term challenges related to rising Social Security and Medicare costs.

Rising deficits. Fitch noted: “We expect the general government (GG) deficit to rise to 6.3% of GDP in 2023, from 3.7% in 2022, reflecting cyclically weaker federal revenues, new spending initiatives and a higher interest burden.”

In a nice bit of timing, the U.S. Treasury on Tuesday issued its “Latest Debt to the Penny” report on Tuesday, just before the Fitch announcement. This is an ugly trend:

  • Total U.S. public debt, Aug 1, 2023 = $32.6 trillion
  • Total U.S. public debt, Aug 1, 2018 = $21.3 trillion
  • Total U.S. public debt, Aug 1, 2013 = $16.7 trillion

So in just 10 years, the U.S. public debt has nearly doubled and this increase is not slowing down, especially with much higher interest payments adding to the burden.

Potential for recession. Fitch noted: “Tighter credit conditions, weakening business investment, and a slowdown in consumption will push the U.S. economy into a mild recession in 4Q23 and 1Q24, according to Fitch projections. The agency sees U.S. annual real GDP growth slowing to 1.2% this year from 2.1% in 2022 and overall growth of just 0.5% in 2024.”

Reaction to the downgrade

Let’s watch the CNBC coverage:

Fitch immediately took heat for this decision and naturally the reactions fell along party lines.

White House press secretary Karine Jean-Pierre said, “It defies reality to downgrade the United States at a moment when President Biden has delivered the strongest recovery of any major economy in the world.”

In a statement, Senate Majority Leader Chuck Schumer, D-N.Y., said the Fitch downgrade reflects “reckless brinksmanship and flirtation with default” by House Republicans and that they “must never push our country to the brink of default again.”

Another Biden administration official called this the “Trump downgrade,” attempting to pin the blame on the former administration.

Louisiana’s former Republican Gov. Bobby Jindal tweeted: “S&P downgraded US credit under Obama, and now Fitch has downgraded US rating under Biden. The excessive spending and borrowing must stop.”

Sigh. Could just ONE politician step forward and say, “Both parties caused this problem and both parties will have to work together to solve it”?

All of this parallels what happened in 2011 when S&P downgraded U.S. debt to the same AA+ rating. That downgrade was called “Black Monday” because it caused a 5.5% one-day drop in Dow Jones Industrial Index. It seems unlikely that we will see a similar fall today because financial markets have become inured to these crises. Bloomberg’s report this morning noted, “In financial markets, the move was met with what amounts to a shrug.”

What was really surprising in 2011 is that U.S. Treasurys strengthened after the downgrade and interest rates fell as the stock market roiled. This chart shows the massive moves in Treasurys and the stock market in August 2011:

Click on image for a larger version.

Again, I don’t expect to see a similar pattern in August 2023. I’ll close with this from Joachim Klement, head of strategy at Liberum Capital, quoted by Bloomberg:

“We think the downgrade of the US credit rating will not have a material impact on equity markets, US Treasuries or the US dollar. While the downgrade came at a surprising moment, it is not unjustified given the large deficit of the US government and the lack of projected deficit reduction in the coming three to five years. But there is no reason to sell US Treasuries or demand an increased risk premium, in our view, since there is no alternative to Treasuries in global bond markets, nor is there any material default risk in the coming decade, in our view. All in all this is a tempest in a teapot.”

Will the downgrade cause me to abandon investments in U.S. Treasurys? No.

Any thoughts? Solutions? Strategies? Post them in the comments area below.

* * *

Feel free to post comments or questions below. If it is your first-ever comment, it will have to wait for moderation. After that, your comments will automatically appear. Please stay on topic and avoid political tirades.

David Enna is a financial journalist, not a financial adviser. He is not selling or profiting from any investment discussed. I Bonds and TIPS are not “get rich” investments; they are best used for capital preservation and inflation protection. They can be purchased through the Treasury or other providers without fees, commissions or carrying charges. Please do your own research before investing.

Posted in Investing in TIPS | 44 Comments

Was July full of good news? Not exactly.

By David Enna, Tipswatch.com

After a long journey home Monday — flying from Budapest to Munich and then on to Charlotte — I am just about ready to rejoin the real world. But with jet lag.

On our entire trip from The Hague to Budapest, I was rarely connected to financial news, even when I had sometimes-decent internet access. I had too much to do and see. So now I am back and trying to reconstruct why my portfolio did so well in the month of July– even though the Federal Reserve again raised short-term interest rates.

Here is my snapshot of the month:

That’s a pretty good month overall. Nearly every investment group saw a gain in total return, and the stock returns were sizable. I’m noticing that investors seem to be backing off a bit today, but nothing serious.

Looking at this chart, it’s obvious that short-term Treasurys are very attractive investments right now, all the way up to the 1-year term. It also appears that the inverted yield curve could be starting to reverse course, but very slowly.

My one complaint

I’ve got a gripe about July, but it really isn’t a major gripe. It’s that #$@!&* 10-year TIPS auction of July 20, which generated a real yield to maturity of 1.495% — decent, but about 8 to 10 basis points lower than I expected. Again, that’s nothing serious, except that in a matter or days real yields rebounded, and now that same TIPS is trading on the secondary market with a real yield of 1.67%.

Click on image for larger version.

Because I wasn’t following financial news, I could find no reason for the sudden dip in real yields on the exact date of the auction. Yes, the auction generated strong demand, but three days later, the 10-year real yield popped higher. Is investor demand for inflation protection increasing? Could be, but July sent mixed messages.

I’ll keep trying to figure it out. If you have ideas, post them in the comments.

A recap of the trip

My site isn’t a travelog, but a lot of readers have been asking about this three-week holiday. It was the Grand European voyage on the Viking cruise line. The vessel was a 443-foot-long Viking riverboat with about 190 passengers and 53 crew. One thing I really liked about this itinerary is that it traveled to many small and historic towns in Germany, where we rarely have traveled.

Everything went pretty much according to schedule. The food was excellent, with many healthy choices. Many of the sites were sensational. Viking generally attracts active seniors, mostly American but we had at least 15 Australians aboard, along with some Canadians and a couple from New Zealand.

Water levels were fine, but that is always a worry on these rivers. The Main-Danube connection canal wasn’t passable, so we had a one-day boat switch from the Viking Modi to the Viking Skirnir. All that went off without a hitch — pack up, tour Nuremberg, eat lunch, bus to Passau and board the new ship.

The trip ended in Budapest, where we got to visit with long-time friends who live there. (She visited Charlotte 35 years ago on a journalism program.) We’ve been to Budapest five times, but it is always special.

If you’d like to ask questions about Viking trips (or Overseas Adventure Travel as an alternative), email me at tipswatcher@gmail.com.

* * *

Feel free to post comments or questions below. If it is your first-ever comment, it will have to wait for moderation. After that, your comments will automatically appear. Please stay on topic and avoid political tirades.

David Enna is a financial journalist, not a financial adviser. He is not selling or profiting from any investment discussed. I Bonds and TIPS are not “get rich” investments; they are best used for capital preservation and inflation protection. They can be purchased through the Treasury or other providers without fees, commissions or carrying charges. Please do your own research before investing.

Posted in Federal Reserve, Investing in TIPS, Treasury Bills | 12 Comments

Social Security COLA looks likely to slip to 3.0% to 3.2% for 2024

Projecting the COLA is a fool’s game. But I’ll try anyway …

By David Enna, Tipswatch.com

With the release of the June inflation report on July 12, we now have a “pretty good” idea of where the Social Security cost-of-living adjustment will be heading for payments in 2024, beginning with benefits received in January.

Click on image for larger version.

I say pretty good because after years of trying to make this projection, I have realized it’s almost impossible to nail it. Why? Because inflation in the summer months is notoriously finicky, and the COLA will be based the average of inflation indexes for July to September.

Last year, I predicted an increase of “about 10%” for 2023 payments. The correct answer was 8.7%.

But I actually got a little lucky last year. In June, I was interviewed by the AARP Bulletin for my thoughts on the COLA increase. After I listed all the iffy issues, the reporter asked, “What if nothing else happens, what would the COLA be?” I answered “about 9%” instead of my 10% prediction. That was very close to the 8.7% result and I somehow looked brilliant when the Bulletin was published in October.

So, to skip right to the good stuff, I am projecting a COLA increase of 3.0% to 3.2% for payments beginning in 2024. And here is how I got there ..

The Index

Annual U.S. inflation (measured by CPI-U) is running at 3.0% as of June, but the Social Security Administration doesn’t use CPI-U. Instead, it uses the Consumer Price Index for Urban Wage Earners and Clerical Workers (CPI-W). For that index, the June annual increase was lower, at 2.3%.

CPI-W includes data only from households with at least 50% of income coming from clerical or wage-paying jobs. I’ve noted in the past that CPI-W generally lags slightly behind CPI-U, which means the Social Security COLA also generally lags behind the standard measure of U.S. inflation. However, in 2021 and 2022 CPI-W ran higher than official inflation.

CPI-W isn’t widely tracked or reported, but the Bureau of Labor Statistics updates the index each month in its overall inflation report. Right now, you could say, “Well, CPI-W is running at an annual rate of 2.3%, so that will likely be the COLA increase for 2023.” But that’s not true. In fact, the June number isn’t necessarily an accurate indicator. It just sets a baseline for future data. Then we come to …

The Formula

The SSA doesn’t look at a full year’s data to determine the COLA. Instead it uses the average CPI-W index for the third quarter — July, August and September. Here is the definition from the SSA site, in typical crystal-clear language of government bureaucrats:

A COLA effective for December of the current year is equal to the percentage increase (if any) in the average CPI-W for the third quarter of the current year over the average for the third quarter of the last year in which a COLA became effective. If there is an increase, it must be rounded to the nearest tenth of one percent. If there is no increase, or if the rounded increase is zero, there is no COLA.

The translation: This wording means the SSA eliminates years where inflation was zero or negative, and so there isn’t a “bounce-up” effect on benefits after a year of deflation. Instead, it goes back to the last year where there was an increase in benefits. But that won’t matter in this calculation for 2024, because the COLA rose 8.7% for payments in January 2023.

So, although 12-month CPI-W was up 2.3% in June, that number is irrelevant. The only inflation numbers that will matter are for the third quarter: July, August and September. Last year, the CPI-W index averaged 291.901 in the third quarter. The June 2023 index was set at 299.394, which is 2.6% higher than the 3rd quarter average in 2022. So if we have zero inflation in July, August and September, the Social Security COLA will be set at 2.6%.

Projecting the 2024 COLA

U.S. inflation can be stubbornly finicky in the summer months, so predicting inflation from July to September is an impossible task. Hurricanes, gas shortages, food crop failures, stock market plunges, outbreaks of war, supply shortages, pandemic resurgence, etc., etc. It’s a guessing game, and nearly every summer brings some surprises.

In 2022, for example, CPI-W actually declined from July to September after surging earlier in the year. Let’s take a look at how differences in 3rd-quarter inflation would alter the COLA for 2024 payments:

View historical data on my Social Security COLA page.

Last year, several media reports in June predicted a 12%+ increase in the Social Security COLA, because those projections saw inflation continuing at the same high rate we saw in the first six months of 2022. But inflation softened dramatically and the COLA dropped to 8.7%, still the 4th largest increase in history.

In my projection, I am theorizing that inflation will not fall dormant this summer, but will continue in a range of 0.2% to 0.3% a month, leading to a COLA projection of 3.0% to 3.2%. But a single deflationary month or a sudden gas-price surge could derail that projection.

FYI, the Senior Citizens League, a nonprofit seniors group that generally makes accurate projections, is predicting a 3.0% COLA increase for 2024.

What this all means

The Senior Citizens League says the average monthly payment to Social Security beneficiaries is $1,787, so an increase of 3.0% would raise that benefit to about $1,841, beginning in January. If you are in the Social Security “limbo” period — older than 62 but not yet taking benefits — your future benefits would also climb by this percentage.

Of course, Social Security recipients won’t really know their bottom line until the 2024 Medicare Part B premiums are announced later this year. Part B premiums are automatically deducted from most beneficiaries’ Social Security benefits.

The actual COLA number won’t be known until 8:30 a.m. EDT on October 11, 2023, when the BLS releases the September inflation report and completes the data needed for the 3rd quarter average of CPI-W.

I will be tracking these numbers for July, August and September as each inflation report is issued. And I’ll keep a running total of the CPI-W changes on my Social Security COLA page.

* * *

Feel free to post comments or questions below. If it is your first-ever comment, it will have to wait for moderation. After that, your comments will automatically appear. Please stay on topic and avoid political tirades.

David Enna is a financial journalist, not a financial adviser. He is not selling or profiting from any investment discussed. I Bonds and TIPS are not “get rich” investments; they are best used for capital preservation and inflation protection. They can be purchased through the Treasury or other providers without fees, commissions or carrying charges. Please do your own research before investing.

Posted in Inflation, Medicare, Retirement, Social Security | 7 Comments

New 10-year TIPS auctions with a real yield of 1.495%, a disappointing result

By David Enna, Tipswatch.com

I am currently cruising down Germany’s Rhine River, with surprisingly limited internet access in a remote area, so this will need to be a quick post.

Today’s Treasury offering of $17 billion in a new 10-year Treasury Inflation-Protected Security — CUSIP 91282CHP9— generated a real yield to maturity of 1.495%, well below expectations. Because the real yield fell just .005% below 1.5%, the coupon rate was set at 1.375% instead of 1.50%.

Still, this auction’s real yield of 1.495% was just slightly higher than the 1.485% generated at a November 2022 reopening auction of this term. That means it generated the highest real yield of any 9- to 10-year TIPS auction since April 2010.

Before the auction’s close, the most recent TIPS of this term was trading all morning with a real yield in a range of 1.54% to 1.59%, so today’s auction looked likely to generate a real yield in that range. The ‘when-issued’ forecast for this TIPS — generated just before the auction’s close — was 1.546%.

The bid-to-cover ratio was 2.51, the highest for this term since May 2022.

So it goes. Demand was high, and the real yield fell in response.

Pricing

This TIPS auctioned at an unadjusted price of 98.893296, and it will have an inflation index of 1.00130 on the settlement date of July 31. That means an investor buying $100 par paid about $99.02 for $100.13 of principal.

Inflation breakeven rate

With the nominal 10-year Treasury note trading with a yield of 3.87% at the auction’s close, this TIPS got an inflation breakeven rate of 2.38%, a bit higher than recent results.

Reaction to the auction

Bloomberg, in an article published July 21, noted both the high demand for this auction and the resulting inflation breakeven rate of 2.38%, which is within range of the Fed’s target. It noted:

If CPI inflation exceeds 2.3%, investors are better off buying TIPS, and on Thursday, they plunked cash on the barrelhead. An auction of new 10-year Treasury Inflation-Protected Securities drew a yield more than 5 basis points lower than where they were trading at the bidding deadline, a sign that demand exceeded dealers’ expectations. …

Unlike in 2021 when investors flocked to TIPS as inflation took off, then suffered steep losses in 2022 as yields soared, TIPS yields remain at or near multiyear highs, providing a cushion in the event that inflation moderates toward the levels priced into the market. …

“Real yields look attractive,” said James Evans, who manages inflation-protected bond funds at Brown Brothers Harriman & Co. “If you think inflation is going to be 3% for a while, that’s a pretty good real return.”

Here is a list of recent TIPS auctions of this term:

And now, I am off to dinner.

• Confused by TIPS? Read my Q&A on TIPS

• TIPS in depth: Understand the language

• TIPS on the secondary market: Things to consider

• Upcoming schedule of TIPS auctions

* * *

Feel free to post comments or questions below. If it is your first-ever comment, it will have to wait for moderation. After that, your comments will automatically appear.Please stay on topic and avoid political tirades.

David Enna is a financial journalist, not a financial adviser. He is not selling or profiting from any investment discussed. I Bonds and TIPS are not “get rich” investments; they are best used for capital preservation and inflation protection. They can be purchased through the Treasury or other providers without fees, commissions or carrying charges. Please do your own research before investing.

Posted in Investing in TIPS | 15 Comments