10-year TIPS reissue auctions with a yield of -0.225%

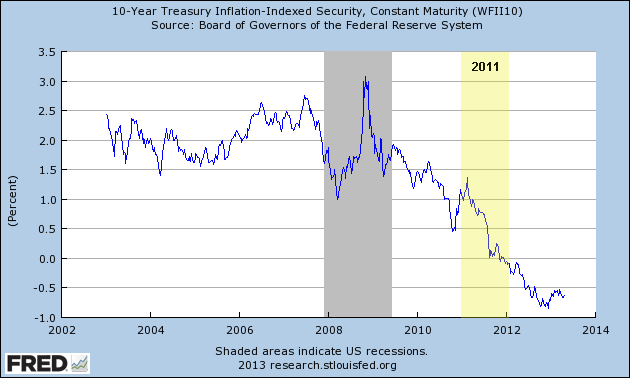
The Treasury just announced that today’s auction of a 9-year, 8-month Treasury Inflation-Protected Security resulted in a yield of -0.225%, the highest yield on a 10-year TIPS in more than a year. This was a bit better than the -0.244% experts were predicting just before the auction.

Here is the Treasury announcement.

CUSIP 912828UH1, with a coupon yield of 0.125%, was first auctioned in January with a yield to maturity of -0.630% and then reissued in March with a yield of -0.602%.

The rise in yield means that buyers at today’s auction will be paying a much lower price for that 0.125% coupon, about $104.27 per $100 of value. That is down from $107.50 from the January auction.

The principal balance of TIPS is adjusted to reflect inflation, so a buyer at today’s auction is accepting a return of 0.225% less than inflation each year over 10 years.

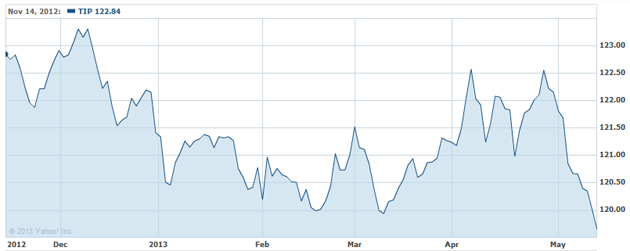
TIPS yields, which have been as low as -0.750% for a 10-year issue, have been rising in the last month because of a trend of weakening inflation, plus a fear among investors that the Federal Reserve soon could halt or slow its bond-buying stimulus.

10-year breakeven rate

At midday today the 10-year Treasury was trading with a yield of 2.03%, making the 10-year inflation breakeven rate 2.255%. This is substantially lower than the lofty 2.54% resulting from the March reissue of this same TIPS. That means TIPS have become cheaper relative to traditional Treasuries.

Analysis of the auction

Carolyn Cui of the Wall Street Journal writes:

With real yield rising to the highest in more than a year, the inflation-adjusted Treasurys attracted decent demand from investment funds and foreign investors. …

One negative reflection of the auction, however, was that it had a light ratio of bidders to the amount of debt sold, at 2.52 times compared with the average of 2.66 times for 10-year TIPS during the past six auctions. As a result, the auction stopped at -0.225%, higher than the -0.246% for similar notes already in circulation before the auction.

Daniel Kruger of Bloomberg writes:

“Investors felt like this was meeting their support levels where they felt it was time to jump back in,” said Michael Lorizio, senior trader at Manulife Asset Management in Boston. “Digging deeper into the data really does spell this as a really solid auction.”


Posted in Investing in TIPS | 9 Comments

Yes or no on the May 23 10-year TIPS reissue?

I am going to say yes on this auction, and that is significant: It will be the first TIPS I will have bought at auction since June 2011, a 30-year TIPS with a yield of 1.774%. I won’t be going ‘all in’ but I will be reinvesting money from a TIPS that matured earlier this year.

I am pretty thankful that a series of economic events have driven the likely yield on this TIPS up to somewhere around -0.28%. That is 35 basis points higher than the yield of this TIPS, CUSIP 912828UH1, when it was first auctioned on Jan. 24, just four months ago.

Yes, I know that -0.28%, plus inflation, is not an attractive yield. But look at the history of recent 9- to 10-year TIPS auctions, and you can see that Thursday’s reissue will be the most attractive since March 2012:

recent TIPS auctions

Back in March 2012, by the way, the auction set an all-time low for a 9- to 10-year TIPS. But things were about to get a whole lot worse, as the Federal Reserve ramped up its bond buying and stoked fears of inflation.

Jump forward to May 2013, and inflation is running an extremely mild 1.1% over the last 12 months. Inflation is currently out of the picture as a major concern. Just look at what Fed Chairman Ben Bernanke said today:

“I would point out that even though we have a dual mandate, that inflation if anything is a little bit too low. Inflation has been very low; the dollar has been strong. We have not in any way failed on that responsibility.”

So inflation fears are dwindling, but at the same time interest rates are rising. Here are numbers for yields on the 10-year nominal Treasury:

  • May 1, 2013 = 1.66%
  • May 10, 2013 = 1.90%
  • May 20, 2013 = 1.97%
  • May 22, 2013 = 2.03%

And then, this is the important point: TIPS are getting cheaper. We have seen a very gradual decline in the 10-year TIPS breakeven rate (nominal Treasury yield minus TIPS yield = breakeven rate). Here is the trend in breakeven rates, drawn from Treasury data:

  • March 16, 2012 = 2.43%
  • Jan. 2, 2013 = 2.53%
  • March 21, 2013 = 2.54%
  • May 1, 2013 = 2.30%
  • May 10, 2013 = 2.35%
  • May 20, 2013 = 2.28%
  • May 22, 2013 = 2.27%

It’s not a dramatic change, but TIPS have been getting steadily cheaper versus nominal U.S. Treasurys.

Thursday’s auction offers a chance to reload with a buy-and-hold 9-year, 8-month TIPS at a yield that is a definite improvement over more than a year of auctions.

The future (for TIPS buyers) may be even brighter. Who knows?

I think it’s time to jump cautiously back into the pool.


Posted in Investing in TIPS | 3 Comments

U.S. inflation drops a sharp 0.4% in April

Is this what deflation looks like? At least for spring 2013, yes.

The Bureau of Labor Statistics announced today that ‘headline’ inflation – known technically as the Consumer Price Index for All Urban Consumers (CPI-U) – decreased 0.4% in April on a seasonally adjusted basis. This was a much sharper fall than the 0.1% drop that experts were expecting.

The non-seasonally adjusted number for April was -0.1%, and has been running at 1.1% over the last 12 months.

This non-seasonally adjusted inflation number is especially important to holders of TIPS and I Bonds, because it is used to adjust the principal balance of TIPS and set the future inflation-adjustment interest rates for I Bonds.

Therefore, TIPS holders will see their principal balances adjusted down 0.1%. Not nice, and this trend seems very likely to force TIPS yields higher, even versus traditional Treasurys. When inflation fear is out of the pictures, TIPS are not in high demand.

(Meaning … possible buying opportunity.)

Read the full CPI report.

As in March, the big deflationary factor was the price of gasoline, which fell 7.9% in April and resulted in a whopping 4.3% one-month decrease in the energy index. The food index, unchanged in March, rose 0.2% in April. The only category showing any real inflation was ‘used cars and trucks,’ which rose 0.6% in the month.

Over the last six months, seasonally-adjusted inflation has netted out to -0.1%, creating a half year of deflation, as shown in this chart:

12 months of inflation

Core inflation? The Federal Reserve tends to ignore headline inflation and watches ‘all items less food and energy.’ Core inflation rose 0.1% in April and has increased 1.7% for the last 12 months. This is well below the Fed’s ‘implied’ inflation top of 2.5%, and seems to open the door for continued bond buying in 2013.

Commentary from the Associated Press report:

Unusually low inflation means consumers can stretch their paychecks and buy more goods and services. But if it were to fall further, it could stoke fears of deflation.

“Subdued demand means that core inflation is likely to edge lower, as retailers will be forced to pass previous falls in raw material costs onto customers,” Paul Dales, an economist at Capital Economics, said in a note to clients. “The Fed may soon put more emphasis on fading inflation trends.”

Posted in Investing in TIPS | Leave a comment

Next up: 10-year TIPS reissue will auction May 23, 2013

The Treasury will issue its formal announcement Thursday, but it’s clear the May 23 auction will be a reissue of CUSIP 912828UH1, which first auctioned in January with a coupon rate of 0.125% and a yield to maturity of -0.630%.

Update: Here is the Treasury announcement.

This one is worth watching. TIPS yields have been rising this year – not drastically but enough to make TIPS interesting again. CUSIP 912828UH1 is now trading on the secondary market with a yield of -0.461%, 17 basis points above the January auction price. Next Thursday’s rate could be even higher, possibly in the -0.410% range.

Although I’ve been writing about TIPS for two years, I haven’t actually bought an issue since June 2011, a 30-year TIPS with a yield of 1.774%. Now I am seriously considering buying this upcoming 10-year reissue, and here’s why:

  • Nominal Treasury rates are beginning to rise. The 10-year Treasury closed Monday at 1.92%, 26 basis points above where it stood on May 1.
  • At the same time, TIPS inflation breakeven rates have been easing. Using that -0.41% yield, the current 10-year breakeven rate is 2.37%, down from 2.51% on the day CUSIP 912828UH1 was issued. This is still high, but better than January. Here is a chart of historic 10-year breakeven rates, showing the recent decline:
  • 10 year breakeven rates
  • As buy-and-hold investment, this 10-year TIPS basically ‘parks’ my money for 10 years, with little income guaranteed but with protection against inflation. The stock market is hitting all-time highs, housing prices are rising, unemployment is declining. Can inflation be far behind?
  • On a personal note, I have two TIPS maturing this year and I need to bolster the super-safe portion of my asset allocation. A yield of -0.410% (plus inflation) isn’t really attractive, but it will park that money in a safe place.
  • Although I hold TIPS that will go down in value if yields rise, I am cheering for higher TIPS yields. I want to be a net buyer of TIPS. Since I am holding to maturity, I don’t care what happens on the secondary market.
  • And of course, a purchase of TIPS only follows an annual maximum purchase of I Bonds ($10,000 per person at TreasuryDirect). I Bonds remain the superior investment when TIPS have a negative real return.

It was interesting to see the TIP ETF finally break through the 120 level this week, closing at 119.65 on Monday.  This six-month chart of TIP shows how it has been teasing a decline, then rising. The recent decline looks more forceful however.

6-month TIPS

Next week’s auction will definitely be worth watching. If yields continue to rise, it will become a definite buy.

Posted in Investing in TIPS | 3 Comments

The TIPS earthquake: When did it happen, and why?

When I started writing this TIPSwatch blog two years ago, I figured I was carving out a boring, staid corner of the investment world, a place where I could share ideas and learn from others. But excitement? Never. Not with TIPS.

But it just so happens that in April 2011, rumblings were beginning in the world of TIPS and Treasury investing. When I look back at TIPS yields in the last two years, I’ve been fascinated to note that in mid-2011, something shifted. Yields dropped dramatically to levels that then seemed impossible: Negative to inflation? At the same time, TIPS grew in popularity, a trend that has continued for two years. Why?

The background

On Jan. 20, 2011, the Treasury auctioned a 10-year TIPS with a coupon rate of 1.25% and a yield to maturity of 1.170%. This was a routine auction and a routine yield. Eight months later, on Sept. 22, this same TIPS was reissued with a yield of 0.078%. A drop of 109 basis points!

This chart shows the amazing drop in TIPS yields over the course of 2011:

2011 10-year TIPS

Below is a chart of month-to-month TIPS yields in 2011, with the month of July highlighted because yields dropped as much as 50 basis points in that single month, sending TIPS prices soaring:

TIPS yields in 2011

But was this a surge in the entire bond market? Or did this earthquake strike selectively and suddenly? The chart below compares the TIP ETF with the AGG (aggregate bond index). The funds have similar intermediate-term durations, and sometimes track fairly closely. But not in 2011:

TIP ETF vs. AGG

This particular chart fascinates me, because again it seems to point to July-August 2011 as the turning point, with TIPS leaping in demand, while the overall bond market was performing mildly. In this next chart I’ve added the volatile long-term Treasury ETF (TLT) and the S&P 500 (SPY) to show that yes, indeed, the earthquake struck precisely in mid 2011 and hit Treasuries (positively) and stocks (negatively):

Splitting point

The earthquake: A surprise ending

I have always been quick to blame Federal Reserve manipulation of the Treasury market for the pathetically low yields on TIPS. So one of the QEs must be behind this sudden shift? Wrong.

  • QE1 began in November 2008
  • A second phase of QE1 began in March 2009
  • QE2 began in November 2010
  • Operation Twist began in September 2011
  • QE4 began in December 2012

Operation Twist, it turns out, was a reaction to the earthquake, not the cause of it. And while the Fed certainly has succeeded in keeping Treasury rates extremely low, it wasn’t the direct cause of the earthquake.

How about the crisis in Europe? Could that have been the cause? No, the Euro crisis had been brewing well before mid 2011. Again, it was only a contributing factor.

Something else happened exactly in late July to early August 2011, and it was the direct cause of Treasurys soaring and the stock market plummeting. Here are some headlines from that time:

All leading to this, epicenter of the earthquake event:

The amazing thing: At the time, I was convinced that the S&P action would put pressure on U.S. government debt, causing interest rates to rise. Instead, it caused massive discontent with the U.S. government and fear for our nation’s future.

Fear was the trigger: The stock market dropped and Treasurys soared. The Federal Reserved stepped in – one month later – to begin Operation Twist, but at that point it had no option. The president and Congress had no answer. One last chart to show the massive one-month moves in Treasurys and the stock market:

August 2011

We now know the S&P action had zero effect on the appeal of Treasurys. And TIPS became even more popular because of their inflation protection. Runway federal spending, combined with Federal Reserve stimulus, raised the specter of inflation.

Not much has changed in the last 20 months, and inflation is still a specter, not a reality.

Posted in Investing in TIPS | 9 Comments