This article is repurposed from a version originally written in June 2018.
For investors in U.S. Savings Bonds – EE and I Bonds – the Savings Bond Wizard was an excellent tool for keeping an accurate inventory and tracking past and current values. But as of June 1, 2018, the U.S. Treasury discontinued the Wizard and replaced it with a Savings Bond Calculator, a tool that’s a little less user friendly.
Exporting data out of the Savings Bond Wizard
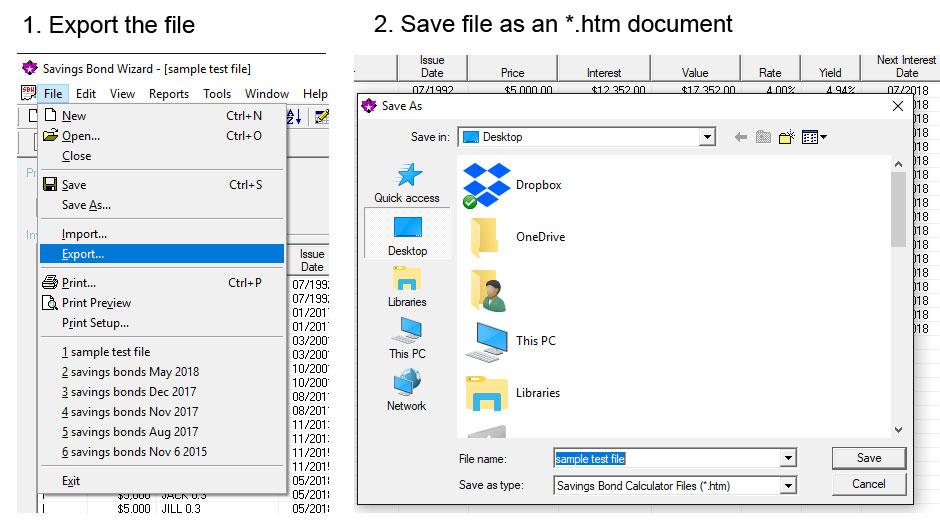
With the Savings Bond Wizard still open, click on File > Export and save your current data as an *.htm file. Make sure to save this file to a place you can find it later, such as your computer desktop or your main investment folder.
Moving data into the Savings Bond Calculator
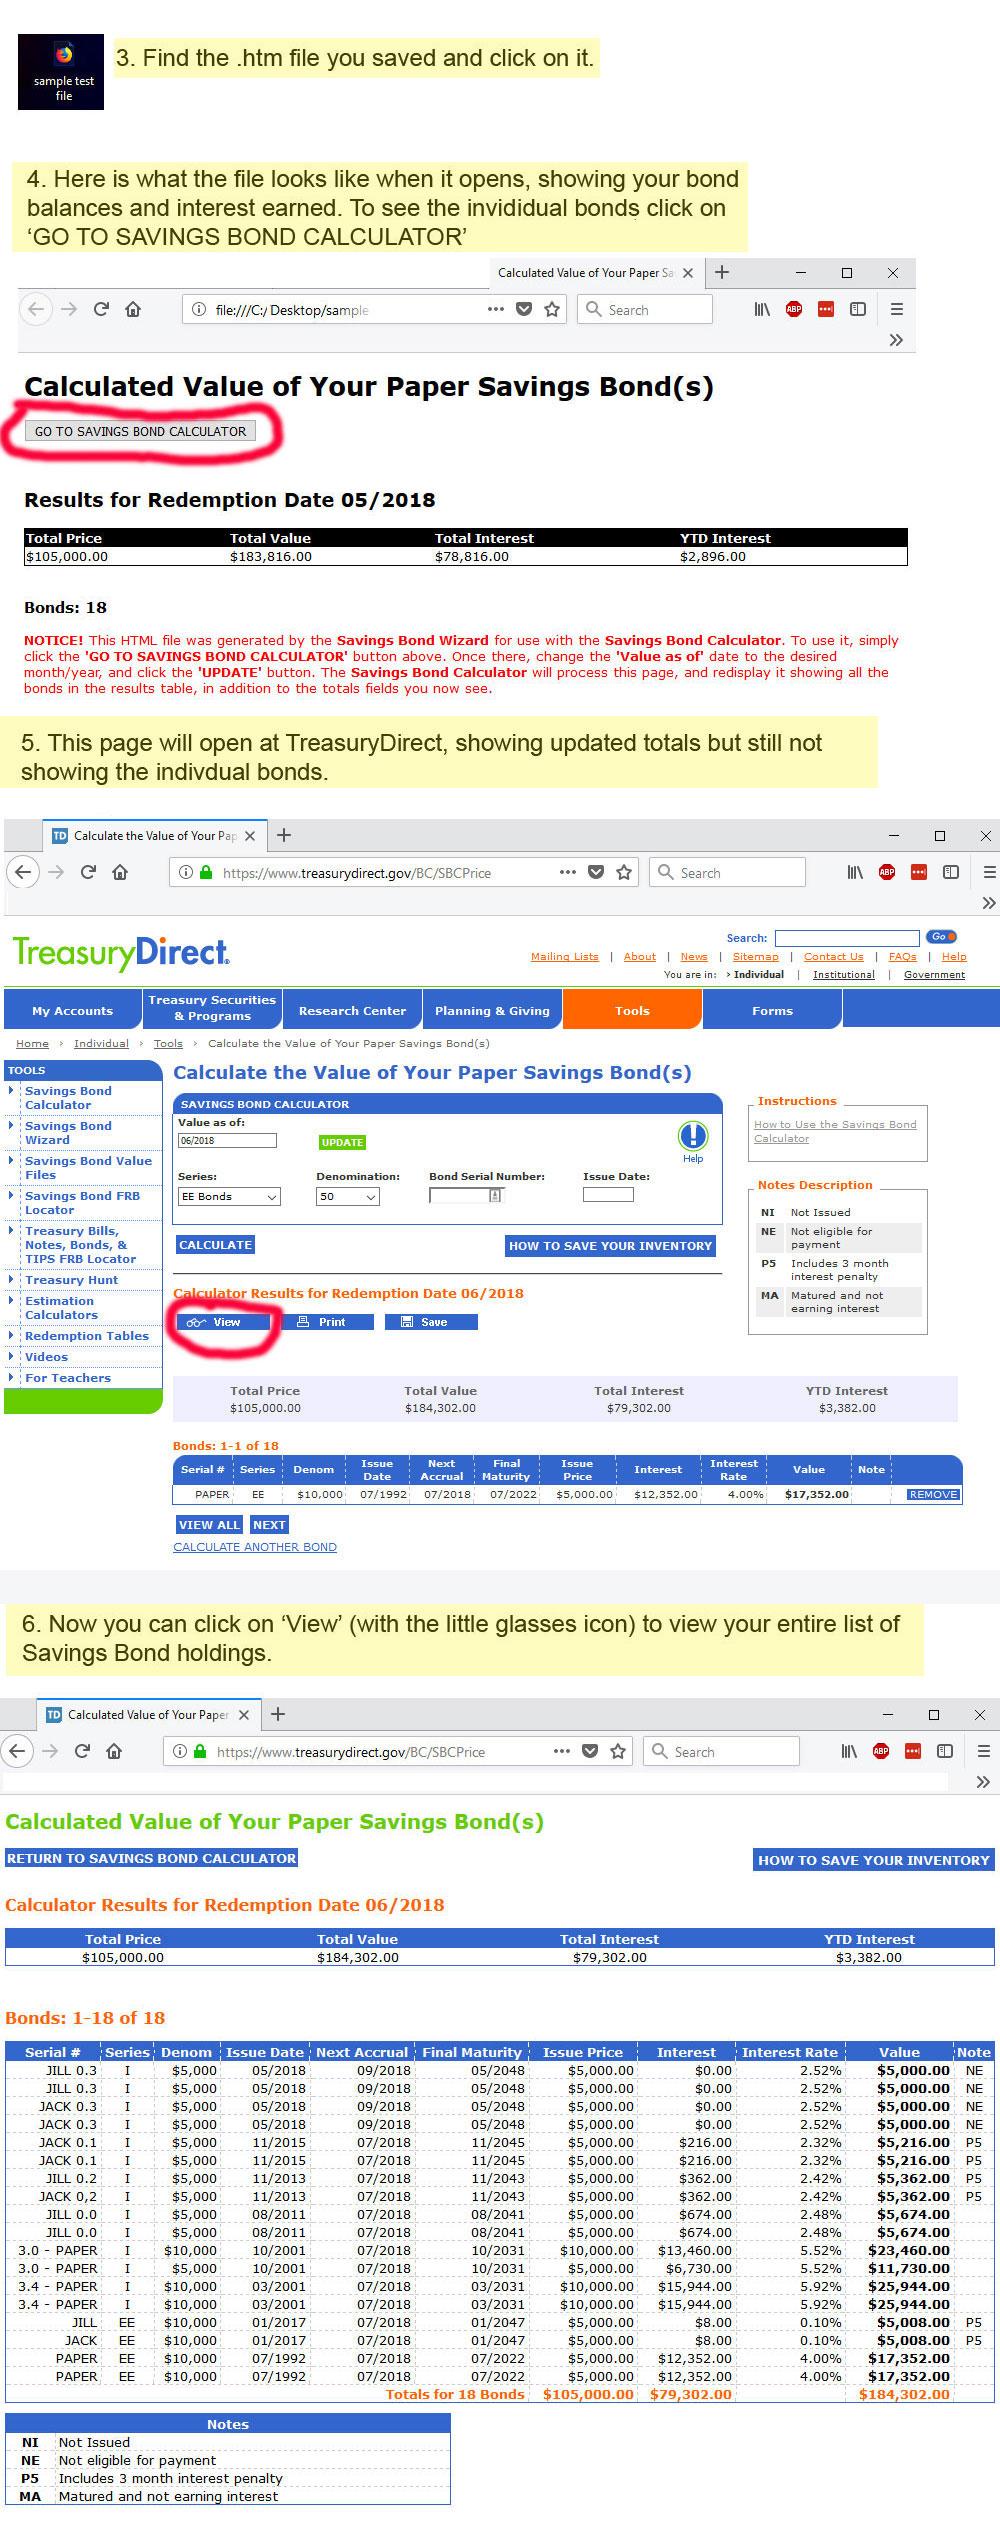
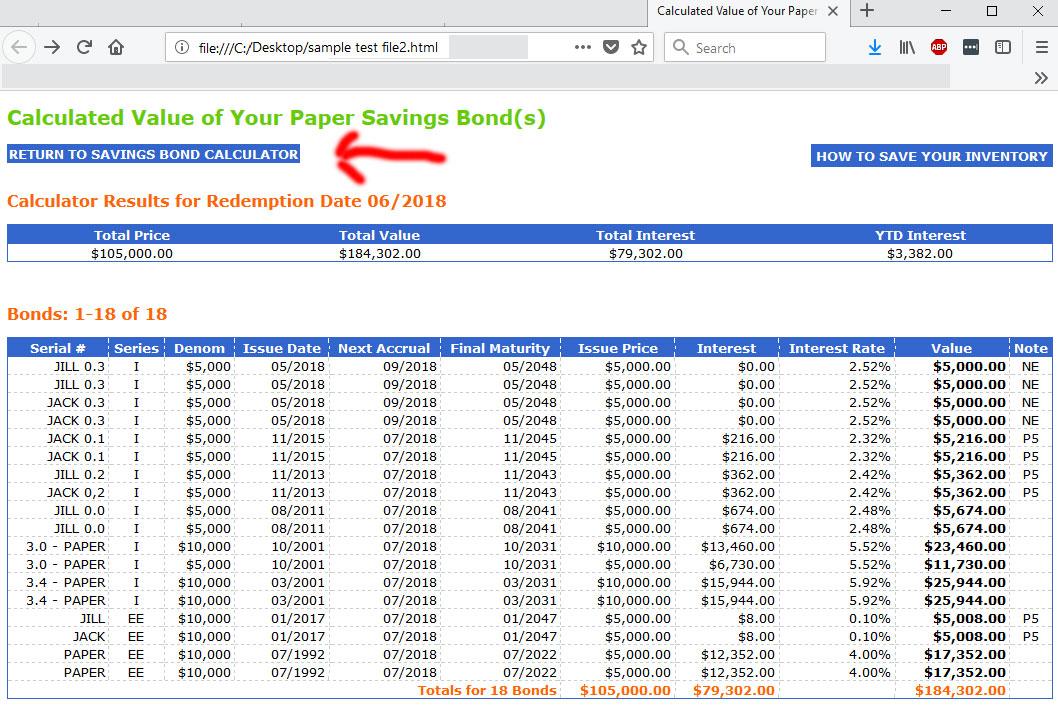
Find the .htm file you saved and double-click on it. Here is the process for what happens next:Note that the data have now updated to June 2018 and the balance total has increased from $183,816 in May to $184,302 in June.
Adding bonds to your inventory
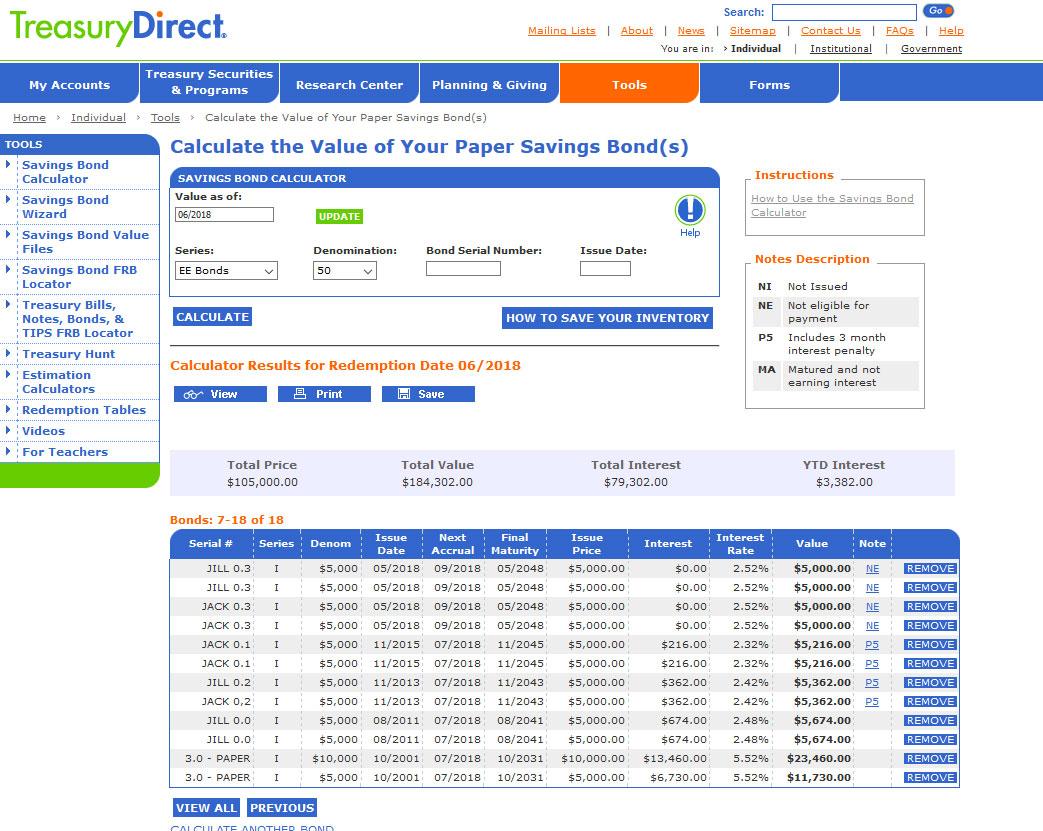
This process works exactly like it did in the Savings Bond Wizard, a bit clunky. It pays to do this carefully and double check your work. From the main page of the Savings Bond Calculator:
In this example, I captured myself trying to enter a $10,000 I Bond into the Calculator. That would not work in the old Wizard and it won’t work in the Calculator, either. For some reason, the Treasury still believes I Bond purchases are limited to $5,000 a year, and will only let you enter $5,000 at a time.
(TreasuryDirect is adamant that the Savings Bond Calculator will not work for electronic I Bonds. But that is not true. It does work, except for the $5,000/$10,000 issue and the results you see will be accurate. But keep in mind that the calculator will not show you the last three months of interest for an I Bond held less than 5 years.)
So you have to enter $5,000 twice to reflect a $10,000 purchase. The same is true for EE Bonds, but it’s a little more tricky. If you enter a $10,000 denomination for an EE Bond, the Calculator converts that to a $5,000 issue price because the denomination equals the EE Bond’s full value in 20 years. So if you just bought $10,000 in EE Bonds, you’d need to enter two $10,000 denomination transactions. The calculator will list the issue price and current value for each correctly as $5,000.
When you hit enter, the bond is immediately added to your inventory. There is no confirmation screen. So be careful when you take this step.If you make an error – or redeem a bond and you want to remove it – just click on the ‘REMOVE’ button on the right hand side of the main-page listing.
Saving your updated Calculator file
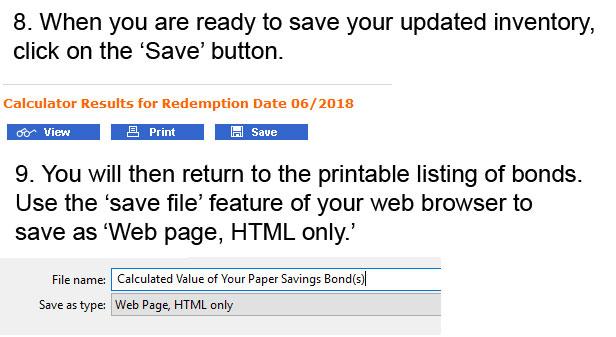
This step is also a little tricky, and is complicated because every Web browser has different ways of saving files. Treasury Direct has a nice rundown of instructions for widely used browsers. Be aware, however, that Google Chrome and Microsoft Edge are listed as ‘not compatible.’ Here are the basic steps:
You probably want to change that file name to something more meaningful and make sure to save it to a place you can find it later. One possibility would be to name it ‘June 2018 Savings Bonds’ … but make sure to save the file as HTML ONLY. Some browsers will try to save the entire web page – photos and all – and you don’t want that.The Calculator directs you to the printer-friendly page to save, which is basic HTML. It should save cleanly.
Returning to this file in the future
I called my file ‘Sample Test File2’ and when I double click on it, it sends me to the printable list of my bonds. At this point, I am viewing the file on my computer and nothing has updated. I need to click on the ‘RETURN TO SAVINGS BOND CALCULATOR BUTTON’ to actually enter TreasuryDirect.
And here is the final result, an updated listing of my Savings Bond holdings in TreasuryDirect, already updated with the Savings Bond Calculator:
A couple of final notes: I noticed that the Calculator eliminated the ‘Yield’ field, which showed the historic composite yield of the bond since it was issued. I think this number may have confused a lot of users – I’ve gotten a lot of questions about it over the years. So the Treasury ditched it.
Also, during the entire process of writing this article, I never logged into TreasuryDirect. The Calculator is not behind a login wall, which makes it very easy to use. Does that raise security concerns? I’d say the concerns are minimal but others might find this troublesome.
At any rate, I would NOT enter the actual serial number into that column. I think very few people use that column for that purpose, anyway. The other information is fairly generic.
The year 2022 broke through several economic milestones, and most of them were dreadful: Highest U.S. inflation in 40 years. U.S. stock market down 20%. U.S. bond market down 13%. Federal Reserve aggressively raising interest rates. War in Europe sending gas prices soaring at mid-year. Pandemic causing supply shortages. Mortgage rates nearly doubling.
But there was a bright side: The Federal Reserve actually stuck to its plan to fight inflation despite possible damage to the U.S. economy. (I was surprised.) And interest rates — especially short-term rates — rose to attractive levels, finally giving investors a chance to build a safe, worthwhile cash holding.
Real yields on Treasury Inflation-Protected Securities also rose to attractive levels, the highest in 15 years. And U.S. Series I Savings Bonds became the surprising star of mainstream financial news.
U.S. inflation
It was easy to see this surge in inflation coming, after years of easy money from the Federal Reserve and massive stimulus payments from Congress. The Fed argued inflation was “transitory.” It wasn’t.
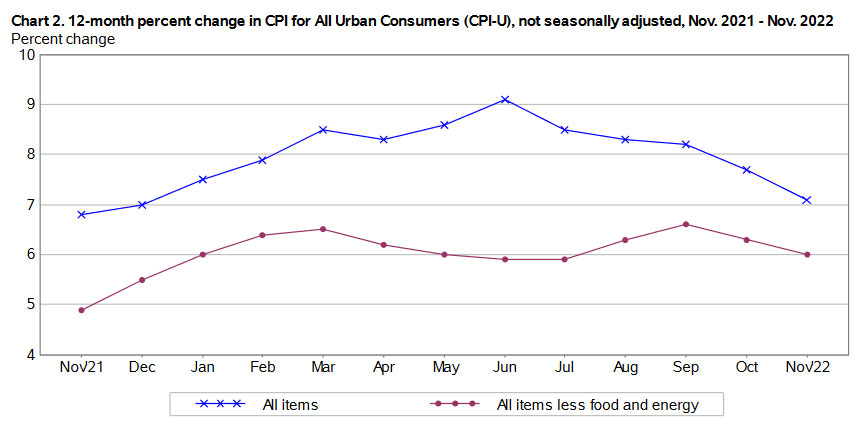
U.S. inflation ended 2021 at 7.0%, the highest annual rate in 40 years. And things got much worse early in 2022, with inflation rising at an annual rate of 12.2% in the six months from January to June, before moderating in the last months of the year. Year-over-year inflation peaked at 9.1% in June 2022, the largest 12-month increase since November 1981.
But since June, inflation has been slipping lower along with falling gas prices, dropping to an annual rate of 7.1% in November. Here is the year-over-year trend in U.S. inflation in the last 12 months, showing the gradual decline in all-items inflation, even as core inflation has remained stubbornly around 6%:
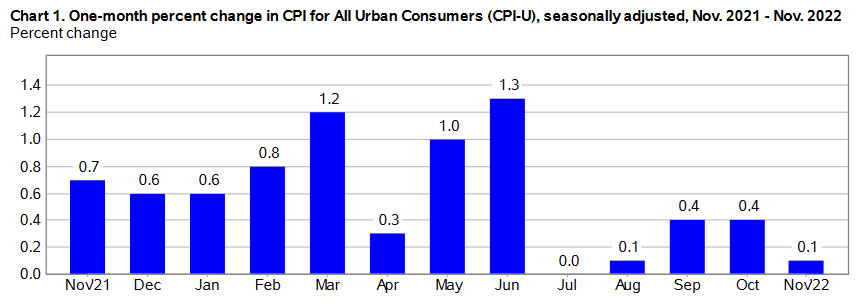
What’s ahead for inflation? It’s impossible to predict, but my gut feeling is that month-to-month and annual inflation will continue to moderate. One reason: Last year’s monthly inflation numbers were very high from December 2021 to June 2022, as shown in this chart:
Even if inflation runs at 0.4% to 0.5% each month through mid-2023, annual inflation will be declining because of the higher year-ago numbers. So could inflation drift toward an annual rate of 4% to 5% in 2023? It looks likely, as long as gasoline prices hold steady. But as I always note: It’s impossible to predict the future. And annual inflation of 4.8% would remain unacceptable in the long term.
I Bonds
U.S. Series I Savings Bonds were already a mainstream hit late in 2021, after the annualized composite rate rose to 7.12% on November 1, 2021. And then inflation surged even higher, pushing the next rate reset to 9.62% on May 1, 2022. For years, I Bonds had been a fairly esoteric and sleepy niche investment. I remember a day in 2021 when CNBC’s Becky Quick asked her co-hosts: “What is an I Bond? I’ve never heard of it.”
Sleepy, no more. Interest in I Bonds became so intense that buyers crafted strategies to double-, triple-, and even quadruple-dip the $10,000 annual investment limit. In October, the flood of buyers crashed the TreasuryDirect website, crippling it for days. And even with the slowdown, the Treasury sold $979 million of I Bonds in one day, on Oct. 28, the last day to lock in the 9.62% rate for six months.
Then, on Nov. 1, 2022, the Treasury made a very welcome decision. Even though it faced raging demand for I Bonds, it raised the fixed rate for I Bonds purchased from November 2022 to April 2023 to 0.4%, creating a composite rate of 6.89% for six months, still highly attractive. That move demonstrated that the Treasury does pay attention to rising real yields, and acted correctly to raise the I Bond’s fixed rate. This was a move I had been urging. Very glad to see this happen; it’s the first I Bond fixed rate above 0.0% since the November 2019 reset.
Treasury Inflation-Protected Securities
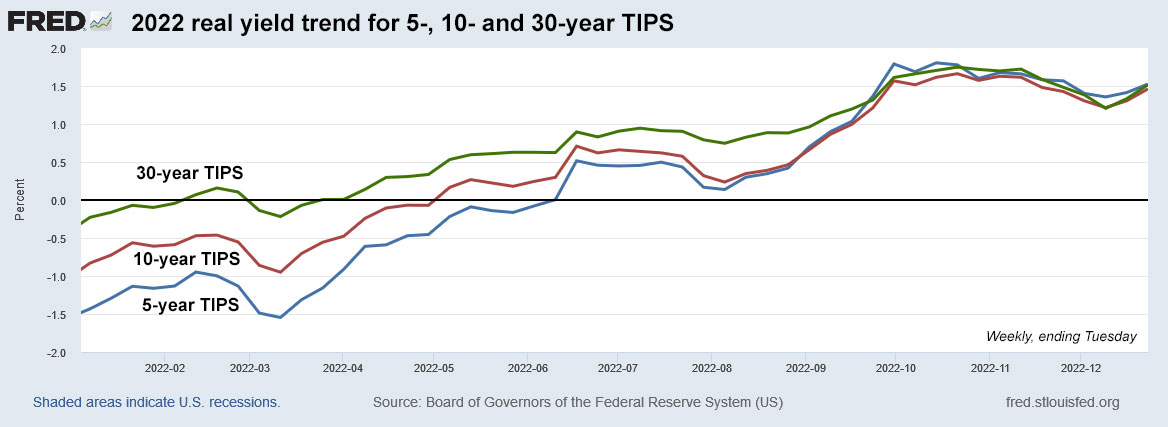
TIPS began the year as an “undesirable investment,” but by mid-year they started getting more and more desirable. The reason can be summed up in this one chart, the trend of TIPS real yields throughout 2022:
Click on the image for a larger version.
Here are the starting and ending real yields for TIPS, based on the market close on Dec. 29:
5-year, started the year at -1.53%. Ending the year at 1.62%, an increase of 315 basis points.
10-year, started the year at -0.97%. Ending the year at 1.56%, an increase of 253 basis points.
30-year, started the year at -0.36%. Ending the year at 1.63%, an increase of 199 basis points.
Obviously, an increase of 250+ basis points of real yield makes TIPS much more attractive today, but holders of TIPS mutual funds and ETFs felt the pain in 2022, even with inflation soaring to a multi-decade high. The TIP ETF has had a total return of about -12% year to date, reflecting its duration of about 6.63 years. The increase in real yields — causing a decline in the value of the underlying TIPS — were enough to wipe out 2022’s inflation accruals.
Investors who buy individual TIPS and hold to maturity can ignore this market volatility, and this was the year when — finally — TIPS became a strong addition to an investor’s “safety” allocation, with real yields surpassing the supremely popular I Bond. Here’s a recap of the year’s TIPS auctions:
CUSIP 91282CDX6: 10-year
The first TIPS auction of the year got a real yield of -0.540%, and its first reopening in March was even worse at -0.589%. This may be the last 10-year TIPS with a coupon rate of 0.125% for awhile. (I hope.)
CUSIP 912810TE8: 30-year
The Treasury stages only two 30-year TIPS auctions a year (and that is plenty, in my opinion.) This TIPS originated in February with a real yield of 0.195% and a coupon rate of 0.125%. By the August reopening the yield was up to 0.92%, and now it trades with a real yield of 1.65% and its price has plummeted to about $64.91, a decline of about 34% in 10 months. Investing in a 30-year TIPS in a rising rate environment is a dangerous idea.
CUSIP 91282CEJ6: 5-year
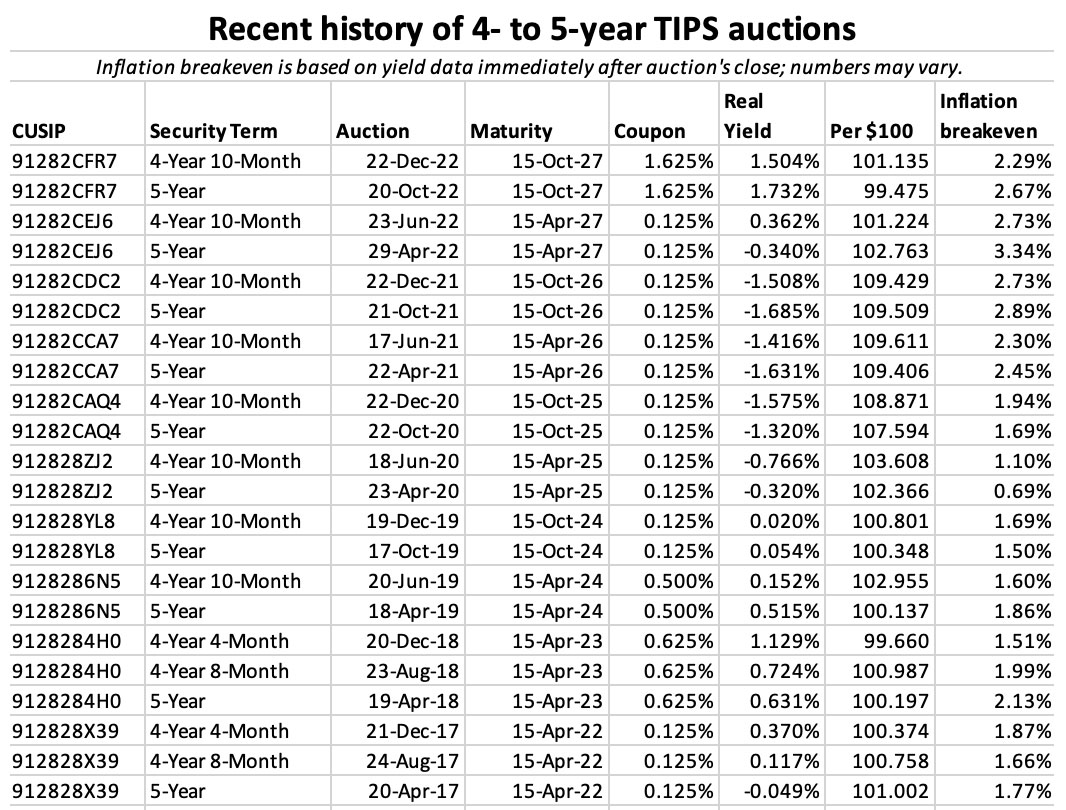
The first 5-year TIPS auction of the year was in April, just as real yields were starting to inch higher. This TIPS got a real yield of -0.340%, but at least it looked attractive versus the year-earlier 5-year auction, with a real yield of -1.631%. At its only reopening two months later, the yield climbed to 0.362%.
CUSIP 91282CEZ0: 10-year
By July, 10-year real yields had climbed to 0.630%, giving this TIPS a coupon rate of 0.625%, the highest coupon for a new TIPS in three years. By November, the real yield had soared to 1.485%, even as the inflation breakeven rate was declining.
CUSIP 91282CFR7: 5-year
By October, real yields were flying high, leading to the most attractive TIPS auction of the year on Oct. 20. This TIPS got a real yield of 1.732% and a coupon rate of 1.625%, both setting 15-year highs. At the time, the result looked disappointing, but it has held up as a very strong yield. By the December reopening, the real yield had slipped to 1.504%, still attractive.
Importance of inflation protection
I know a lot of investors have been flooding into I Bonds (and more recently, TIPS) as yields have become attractive against a backdrop of harsh inflation. I’m sure many of those investors will eventually move on to the next “hot thing,” and that is fine. But I’ve argued for a decade that it makes sense to keep a certain portfolio allocation dedicated to inflation protection, through I Bonds and individual TIPS held to maturity. Maybe that allocation could be 5%? 10%? 15%?
This incredible and awful year, 2022, has demonstrated the need for inflation protection. That need will still be with us in 2023 and beyond.
Happy new year, everyone.
* * *
Feel free to post comments or questions below. If it is your first-ever comment, it will have to wait for moderation. After that, your comments will automatically appear.Please stay on topic and avoid political tirades.
David Enna is a financial journalist, not a financial adviser. He is not selling or profiting from any investment discussed. The investments he discusses can be purchased through the Treasury or other providers without fees, commissions or carrying charges. Please do your own research before investing.
New investors are baffled by Treasury Inflation-Protected Securities. Can’t blame them.
By David Enna, Tipswatch.com
A year ago, while real yields for Treasury Inflation-Protected Securities were still deeply below zero, I worked with a Wall Street Journal reporter on a detailed story about investing in TIPS. Things got difficult when we got to the subject of “real yield to maturity.”
Financial reporter: “This doesn’t make sense. What is my actual return? If inflation is 7.0%, why isn’t my real yield to maturity 7.0%? I don’t get it. I’m going to leave real yield to maturity out of the article.”
Me: “You can’t do that! It’s too important. It’s the key to understanding TIPS and investing in TIPS. Your editor will never approve it.”
Wrong. The article on investing in TIPS was written, approved and published, without ever mentioning real yield to maturity.
A year later, TIPS are a rising star of the investment world, with … er … real yields to maturity at their highest levels in 12 to 15 years, much higher than the future yield of highly popular U.S. Series I Savings Bonds. Now I am getting a lot of questions about TIPS. I have a Q&A on TIPS that answers many of those questions, but I thought it would be helpful to discuss, in detail, the complex language of TIPS. If you understand the language, you will better understand TIPS.
Par value
Par value is the bedrock of a TIPS investment. At some point, when you buy a TIPS at auction or on the secondary market, you will enter a dollar amount in a box. The dollar amount you enter is the par value of the TIPS you are purchasing.
TreasuryDirect’s purchase form. Purchase amount = par value.
Par value, almost always, is not what you will actually pay for that TIPS. The actual cost will be determined by a combination of factors, but par value is 1) the amount the Treasury guarantees will be returned to you at maturity, no matter what happens with inflation, and 2) the base amount you will use to determine the current accrued value of your TIPS.
Coupon rate
After the initial auction of a TIPS, the Treasury sets its coupon rate at the 1/8th-percentage-point increment below the auctioned real yield. (All coupon rates are set at 1/8th percentage points … 0.125%, 0.250%, 0.375%, etc. If the TIPS auctions with a negative real yield, it gets a coupon rate of 0.125%, the lowest the Treasury will go for a TIPS.)
For example, at the July 21, 2022, auction of a new 10-year TIPS, the auctioned real yield was 0.630% and the coupon rate was set at 0.625%.
The coupon rate remains the same until that TIPS matures, even if the real yield to maturity rises or falls in the future. For example, that July TIPS later reopened in November with a a real yield of 1.485%, but its coupon rate remained at 0.625%.
The coupon interest on a TIPS is biannual, paid out every six months. It is not reinvested. But while the coupon rate remains the same, the amount actually paid will rise (or possibly fall) to match the accrued principal of the TIPS.
Real yield to maturity
What is it? It is the total return your TIPS investment will earn above (or below) official U.S. inflation for the term of the TIPS. The term “real yield” means “yield above inflation.” Other Treasury issues and bank CDs have a defined “nominal” yield, but investors can’t know the future real yield. TIPS have a defined real yield, but investors can’t know the future nominal yield. It all depends on future inflation.
The real yield of any TIPS is constantly changing, based on market sentiment. But the important factor is: When you buy a TIPS you plan to hold to maturity, you have set in stone your real yield to maturity. The market may reprice that TIPS, but your real yield doesn’t change, unless you sell before maturity.
A key thing to remember about the real yield: After you purchase a TIPS, and pay a premium or discount to par value to create the real yield to maturity, this is what you will earn going forward:
Inflation accruals + coupon rate
In other words, your real yield was set by the price you paid. After that, you earn the rate of inflation + future coupon payments.
Pricing of a TIPS
How is the price of a TIPS determined? At the original auction, investors bid based on the desired real yield to maturity, because at that point there is no set coupon rate. At a reopening auction or on the secondary market, investors know the coupon rate, so bidding is based on how much the real yield will vary from that coupon rate.
You will see TIPS prices based on $100 increments, and that is how much you will pay for $100 of the TIPS’ current value (par value + inflation accruals). If the coupon rate is below the market real yield, then the price of the TIPS will be lower than $100. If the coupon rate is higher than the market, the price of the TIPS will be higher than $100. Here’s an example of how that worked for the 10-year TIPS issued in July 2022:
Originating auction. Even at an original auction, the TIPS price is unlikely to be exactly $100. That’s because: 1) the coupon rate will be slightly below the auctioned real yield (when the real yield is above 0.125%), and that will slightly lower the price you pay, and 2) even a new TIPS will have some inflation and interest accruals. A new TIPS is issued on the 15th of the month, but the settlement date is on the last business day of the month. So an investor is getting about 15 days of accrued inflation and interest.
Take the July 2022 10-year TIPS as an example:
The auctioned real yield, called “high yield” in this chart, was 0.630%, so the Treasury set the coupon rate at 0.625%. That set the unadjusted price for par value at about $99.951. But then you have to calculate in the fact that this TIPS would have an inflation index of 1.00495 on the settlement date of July 29, plus it would earn a few cents of interest in those 14 days.
$100 par value x .99951 unadjusted price = $99.952
$99.952 x inflation index of 1.00495 = $100.446 adjusted price
Plus the investor would prepay for about 2 cents of accrued interest.
Reopening auction. Now let’s quickly look at the result of the 10-year TIPS reopening auction on Nov. 17 for this same TIPS, CUSIP 91282CEZ0. Over the four months from the originating auction, real yields soared higher, so the pricing was quite different.
Note that the coupon rate remained at 0.625%, set by the original auction. But the auction resulted in a much higher real yield to maturity, 1.485%. And because of that, the price paid by investors was deeply discounted.
$100 par value x .92312 unadjusted price = $92.3126
$92.3126 x inflation index of 1.02147 = $94.2946 adjusted price
Plus the investor prepaid for about 23 cents of accrued interest
The key factor here is that the real yield to maturity was created by market demand, and because the real yield was higher than the coupon rate, the price of the TIPS was lower. When you buy a TIPS, whether at an opening or reopening auction or on the secondary market, the real yield to maturity is the key factor to consider. If you hold to maturity, it sets your future return over U.S. inflation.
Non-competitive bidders — that’s all of us — at both new and reopened TIPS automatically get the high yield. Big-money investors make competitive bids, which could be rejected. All winning competitive bids also get the high yield.
Accrued interest. As a side note, you pay for the accrued interest after the sale closes, but this money is not added to the principal of the TIPS. You will get that money back at the next coupon payment; in the case of this July 2022 TIPS, on January 15, 2023.
Inflation accruals
Inflation accruals for TIPS are based on non-seasonally adjusted inflation from two months earlier. The Treasury takes that inflation number and creates an inflation index that changes every day, up or down depending on if inflation was positive or negative two months earlier. For example, non-seasonally adjusted inflation rose 0.41% in October 2022, so TIPS inflation accruals in December are rising 0.41.%. In November, non-seasonal inflation dropped 0.10%, so inflation accruals will decline 0.1% in January.
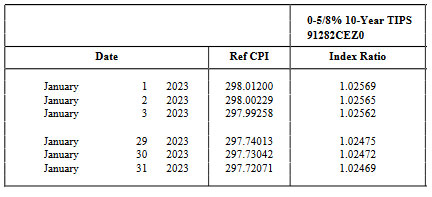
Each month, on the day the U.S. inflation report is released, the Treasury issues new inflation index ratios for all TIPS for the month two months ahead of the report. Here is the full list of January inflation indexes, based on November inflation. And here is how those numbers look for the TIPS issued in July, CUSIP 91282CEZ0:
In that chart, note that the index ratio for Jan. 1 is 1.02569 and through the month will decline to 1.02469 on Jan. 31 because November was a slightly deflationary month. These inflation indexes are crucial because they set the base principal amount for all TIPS, every single day. That means if you sell a TIPS on the secondary market, you will get the full value of your earned inflation.
Accrued principal value
TIPS have a “market value” — set by the market based on constantly changing real yields to maturity, but also a “current principal value,” which ignores the market shifts and simply measures the current total of par value + inflation accruals. If you are holding to maturity, you can simple track the current accrued principal value with this equation:
Par value x inflation index = Accrued principal
If you bought $10,000 par value of a TIPS and it currently has an inflation index of 1.05672, that TIPS now has $10,567.20 of accrued principal. That number is important because it is the base for the next coupon payment. As it rises, the coupon payment also rises.
At maturity, any TIPS will pay par value x inflation index, along with one final coupon payment. It’s not complicated if you hold to maturity.
Current market value
The accrued principal value is one factor used to determine the current market value of a TIPS on the secondary market. As market real yields rise and fall, the price of the TIPS rises and falls. So the price could be $90 for $100 of value, or $110 for $100 of value, depending on how much the coupon rate varies from the market-set real yield.
Secondary market purchase. When you purchase a secondary-market TIPS at a brokerage, you will be putting a dollar amount in a box, just like at TreasuryDirect. But that is not what you will pay. It is the par value you are purchasing. Your actual purchase would look something like this for a TIPS with a price of $95 and an inflation accrual of 1.15:
You place an order for $10,000 par value
Principal you are purchasing: $10,0000 x 1.15 = $11,500 accrued value
Your cost: $11,500 x .95 = $10,925
Plus some small amount of accrued interest.
And in some cases, a brokerage commission.
So, in this simplified example, you’d be paying $10,925 for $11,500 of principal. From that moment on, until maturity, you’d be earning inflation + coupon payments. You accepted a below-market coupon rate, but were rewarded with a price discount. It all balances out. Par value is $10,000, so even if severe deflation strikes, you are guaranteed to receive at least $10,000 at maturity, along with coupon payments along the way.
As you go through the brokerage purchase process, you may see “yield to worst” listed as the yield. That is the real yield to maturity. This “worst” terminology refers to callable bonds, but TIPS aren’t callable and the worst yield is the actual real yield to maturity.
Inflation breakeven rate
This is a measure of market sentiment toward future inflation. It is calculated by subtracting the real yield of a TIPS from the nominal yield of a Treasury of the same term. For example, at the Dec. 20 market close, the 10-year inflation breakeven rate was 2.24%, based on Treasury estimates.
10-year Treasury note was yielding 3.69%
10-year TIPS had a real yield of 1.45%
3.69% – 1.45% = 2.24%
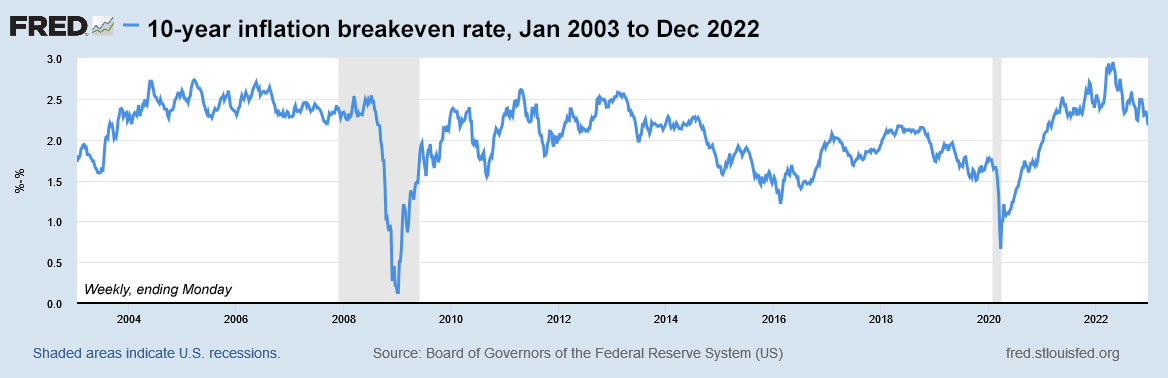
Keep in mind that the inflation breakeven rate isn’t a great predictor of future inflation. It just measures market sentiment. Here is the trend in the 10-year inflation breakeven rate from 2003 to 2022. Look at the 2012 to 2108 era. Do you see any prediction or even hint of our current surge to 40-year-high inflation, topping 7% a year over the last two years?
Click on the image for a larger version.
The inflation breakeven rate is a useful tool, however, because it shows how “expensive” TIPS are versus a nominal Treasury. The lower the inflation breakeven rate, the cheaper the relative cost of a TIPS. Right now, with the 10-year at 2.24%, we are at the border of expensive, but the inflation trend has dramatically changed in the last two years. TIPS look attractive, in my opinion.
Final thoughts
I know that TIPS are an esoteric and confusing investment. I was at a party the other night and a friend told me, “I have TIPS in my portfolio but I have no idea how they work.” Yeah, I hear you. Things get less complicated if you invest in individual TIPS and hold to maturity, ignoring market swings. Then you can track current value with a simple Excel spreadsheet: Par value x inflation index.
I am sure I didn’t get close to answering all the possible questions or solving all the mysteries. I’ve been writing about TIPS for more than a decade and I still come across new concepts. It’s a learning process and I hope this article helps. If you did find this article helpful, please share it with friends who are new to investing in TIPS.
* * *
Feel free to post comments or questions below. If it is your first-ever comment, it will have to wait for moderation. After that, your comments will automatically appear.Please stay on topic and avoid political tirades.
David Enna is a financial journalist, not a financial adviser. He is not selling or profiting from any investment discussed. The investments he discusses can be purchased through the Treasury or other providers without fees, commissions or carrying charges. Please do your own research before investing.
Some readers are reporting discrepancies.Any ideas?
By David Enna, Tipswatch.com
After I posted my article on Thursday’s reopening auction of CUSIP 91282CFR7, creating a 4-year, 10-month TIPS, several readers reported discrepancies in the pricing being reported by their brokers. In some cases, the broker may have charged a commission or fee. But that is baffling, because many brokers claim to execute Treasury auction purchases with zero commissions or fees for online orders.
This pricing ought to be clear-cut. It should exactly match the prices reported by the U.S. Treasury after the auction closed at 1 p.m. Thursday. Here is the Treasury’s summary:
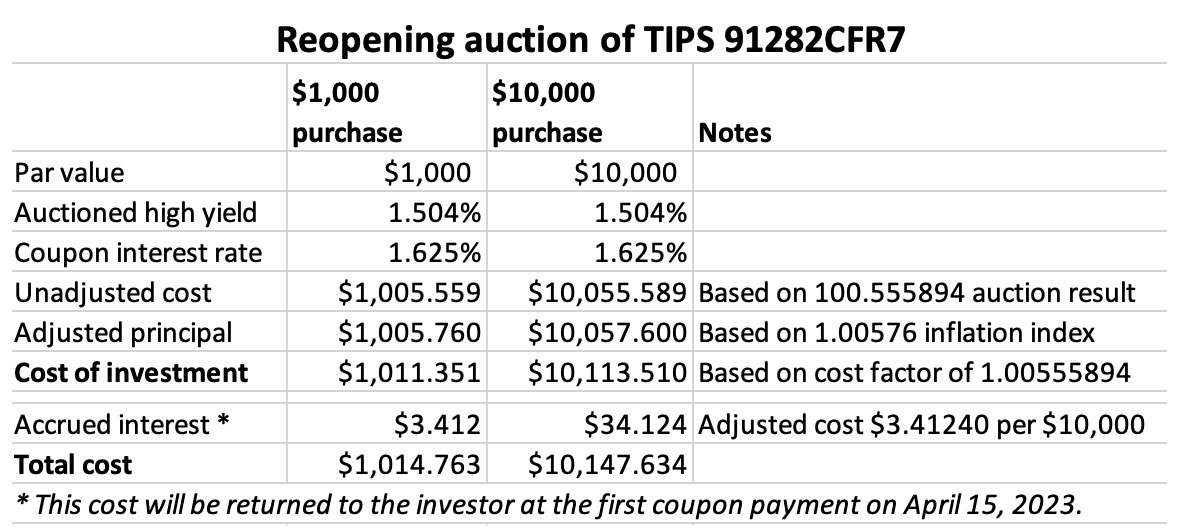
And here is my estimation of the investment’s cost based on that Treasury data:
I can understand that different brokers will have different ways of detailing the cost. For example, Vanguard reports the unadjusted cost, the adjusted principal, and then the result of this simple calculation:
Unadjusted cost (as a factor like 1.00555894) x adjusted principal = investment cost
My only experience is at Vanguard for brokerage purchases at Treasury auctions, and their reporting system seems quite clear-cut. Other brokers may list different factors, but the resulting investment cost should be the same. For Thursday’s auction, the adjusted cost was $101.135096 for $100 of value. On top of that cost was accrued interest of $3.41240 per $1,000 of value.
I am not sure why some readers seeing differing costs, while others are seeing costs that match the Treasury’s reporting. But I suspect brokers are adding some sort of fee to the transaction. One reader has reported that E-Trade admitted overcharging him. But others at TD Ameritrade are also reporting issues.
I am posting this to give readers a chance to double-check broker transactions for this TIPS. What prices were you seeing on your transaction? Can anyone offer a logical explanation for our group for these discrepancies?
Anyway, have a wonderful holiday weekend.
* * *
Feel free to post comments or questions below. If it is your first-ever comment, it will have to wait for moderation. After that, your comments will automatically appear.Please stay on topic and avoid political tirades.
David Enna is a financial journalist, not a financial adviser. He is not selling or profiting from any investment discussed. The investments he discusses can be purchased through the Treasury or other providers without fees, commissions or carrying charges. Please do your own research before investing.
The Treasury’s offering today of $19 billion in a reopening of a 5-year Treasury Inflation-Protected Security generated a real yield to maturity of 1.504%, a good result for investors. This is CUSIP 91282CFR7, and the reopening created a 4-year, 10-month TIPS.
This TIPS was created in an originating auction on Oct. 22, 2022, and at that time got a real yield of 1.732%, the highest for any TIPS of this term in 15 years. The coupon rate was set at 1.625%, also a 15-year high.
In the two months since that original auction, real yields have been drifting lower. Before today’s auction closed at 1 p.m ET, this TIPS was trading on the secondary market with a real yield of about 1.48%, so the auction result of 1.504% was a positive result for investors. Since April 2009, this is only the third auction of the 4- to 5-year term to get a real yield higher than 1%.
Here is the trend in 5-year real yields over the last two years, showing the sharp rise higher beginning in spring 2022, and then the drift lower in the last two months:
Click on the image for a larger version.
Pricing. Because the auctioned real yield came in below the coupon rate of 1.625%, investors had to pay a premium price for this TIPS. The unadjusted price was about $100.56 for $100 of value. The adjusted price was about $101.14 for $100.58 of value, including accrued inflation. This TIPS will have an inflation index of 1.00576 on the settlement date of Dec. 30.
In addition, investors will pay about 34 cents per $100 of value for coupon interest through the settlement date. That money will be returned at the first coupon payment on April 15.
Inflation breakeven rate
At the auction close at 1 p.m., the nominal 5-year Treasury note was trading with a yield of 3.77%, creating an inflation breakeven rate of just 2.26% for this TIPS. That looks highly attractive and means that this TIPS will outperform the nominal Treasury if inflation averages higher than 2.26% over the next 4 years, 10 months.
Later this afternoon, three hours after the auction close, the 5-year nominal rose to 3.80% and this TIPS was trading with a real yield of 1.53%, even higher than the auction result. That pushed the market’s breakeven rate slightly higher, to 2.27%.
Here is the trend in the 5-year inflation breakeven rate over the last two years, showing the remarkable decline lower since the spring, as the Federal Reserve has taken a hawkish posture against inflation:
Click on the image for a larger version.
Reaction to the auction
Something interesting was happening here, but I’m not exactly sure what. The auctioned real yield climbed higher than expected, which would indicate weak demand. The bid-to-cover ratio was 2.59, which indicates acceptable demand. But my curiosity was aroused when I saw that the high yield of 1.504% was allocated to only 33% of investors. At the October auction, the “allocated at high” was 58%. Last December, it was 82%.
What does it all mean? Who knows, but today’s auction ended up with a real yield above 1.5%, which I consider attractive, along with a lower-than-expected inflation breakeven rate. Investors can be happy with this result.
This auction closes the books on CUSIP 91282CFR7, one of the most attractive TIPS offerings in more than a decade. A new 5-year TIPS will be auctioned April 20, 2023.
Coming Tuesday. I will be publishing a guide to the “Language of TIPS,” the result of a “valiant” effort to explain the complex terminology and processes. Did I succeed? Look for that Tuesday morning.
* * *
Feel free to post comments or questions below. If it is your first-ever comment, it will have to wait for moderation. After that, your comments will automatically appear.Please stay on topic and avoid political tirades.
David Enna is a financial journalist, not a financial adviser. He is not selling or profiting from any investment discussed. The investments he discusses can be purchased through the Treasury or other providers without fees, commissions or carrying charges. Please do your own research before investing.

 Note that the data have now updated to June 2018 and the balance total has increased from $183,816 in May to $184,302 in June.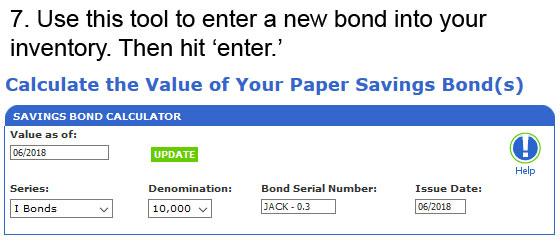













Agreed.Some folks will always want to just lump sum everything in January. I understand those folks! I understand the desire…