Don’t go ballistic over the way TreasuryDirect reports I Bond interest

Confusing? Aggravating? Of course, but also correct.

By David Enna, Tipswatch.com

I’ve had several communications recently from readers who are new to U.S. Series I Savings Bonds and freaking out by the apparently low interest payments reported so far on the TreasuryDirect website. Here’s an example from this week:

After fourteen months, the value of my (March) 2021 bond has increased only 3.84%, or by $384. If the bonds truly tracked inflation, they would have increased by at least $850 – one year at 8.5% plus another two months’ interest. … I suspect the 6-month calculation period is the clever “trick” by which the government sees offering these bonds as worthwhile. It is what gives the house the advantage. … I feel swindled.

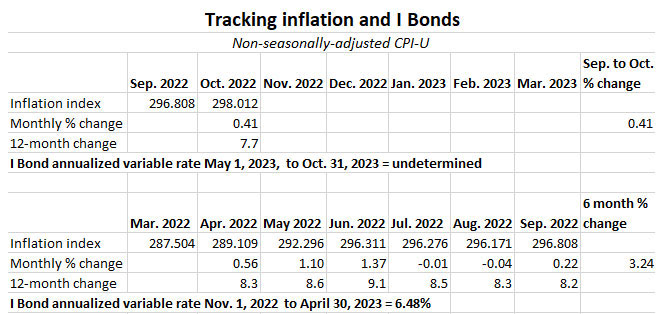
First of all, and most importantly, the Treasury is not swindling anyone. I Bonds do accurately track official U.S. inflation, but investors need to keep in mind that the I Bond’s current variable rate is set by inflation six months in the past. Eventually, if you hold them, all I Bonds catch up to current U.S. inflation (either up or down).

This particular reader purchased $10,000 in I Bonds in March 2021 and then $10,000 again in March 2022. In my opinion, those were excellent investments. But the reader has looked at the TreasuryDirect website and sees his two I Bonds have earned only $500 in interest so far, when current U.S. inflation is running at 9.1%. He asks: “Why?” (And he is not alone. I get this sort of question several times a week.)

Note: I wrote an updated article on the Treasury’s interest rate calculations. View it here.

What is happening here?

The key issue is that I Bonds cannot be redeemed for one year, and I Bonds redeemed from year one until year five will lose the last three months of interest. When you look at your I Bond earnings on TreasuryDirect — if you haven’t yet held them 5 years — the interest that TreasuryDirect reports WILL NOT include the latest three months of interest.

A second issue is that when I Bonds are issued, they earn the current variable rate for a full six months before transitioning to the next variable rate, and so on, every six months. Eventually, all I Bond holders get exactly the same variable rates, but the trigger dates are staggered by the month of issue.

In the case of this reader, the I Bonds were purchased in March, which means that the variable rate will update each September and March. This is crucial for understanding the interest calculation.

Example one: I Bond issued in March 2021

I used TreasuryDirect’s Savings Bond Calculator to get the current value of a $10,000 I Bond issued in March 2021. Because the calculator is supposedly “only” for paper I Bonds, I had to enter $5,000 twice into the calculator. Here is the result:

The reader was correct in noting that this I Bond had only earned $384 in reported interest since March 2021. Why is that? One factor is that in March 2021, the I Bond’s composite rate was 1.68% (fixed rate of 0.0% + variable rate of 1.68%) for a full six months. And now I will let my chart take over:

Well, look! … This March 2021 I Bond has not yet started earning the current 9.62% composite interest rate because it is still in the six-month period earning 7.12% interest, though this month. In September, the I Bond will begin earning 9.62%, earning at least $482 over the September to February period.

My total of $380 differs from TreasuryDirect’s $384 because of compounding, but close enough.

The I Bond so far has earned $558 in interest (actually a little more with compounding), but TreasuryDirect will only report $384 because it will always eliminate the last three months of interest for an I Bond that hasn’t yet hit the 5-year mark.

A bit of advice: Before redeeming any I Bond before 5 years, make sure to check the term of the current composite rate. In this March 2021 example, you wouldn’t want to sell the I Bond until three months after the 9.62% rate runs its course. That would be June 2023, at the earliest, but the next variable rate could be nearly as high.

Example two: I Bond issued March 2022

Here is TreasuryDirect’s calculation:

This one is a lot simpler. TreasuryDirect says that this I Bond has earned $116 interest so far. Again, the composite rate is 7.12% through August, and then will transition to 9.62% from September to February.

Here’s my calculation of how this interest was determined:

In this case, my calculation matches the TreasuryDirect number because no compounding has yet taken place for this I Bond. The first accrual will be in September, so the principal balance will climb a bit just as the 9.62% interest rate kicks in.

Final thoughts

I may be weird, but I actually trust the way the Treasury reports my I Bond interest, but I know all about the quirks of the three-month penalty and staggered variable rates. I recently redeemed EE Bonds we purchased in 1992 and the Savings Bond Calculator nailed our proceeds to the penny. The Treasury is not looking to cheat Savings Bond investors, I am certain of that.

Not everything in life is a conspiracy to cheat you. Savings Bonds are a trustworthy investment.

Confused by I Bonds? Read my Q&A on I Bonds

* * *

Feel free to post comments or questions below. If it is your first-ever comment, it will have to wait for moderation. After that, your comments will automatically appear.

David Enna is a financial journalist, not a financial adviser. He is not selling or profiting from any investment discussed. The investments he discusses can be purchased through the Treasury or other providers without fees, commissions or carrying charges. Please do your own research before investing.
Posted in Cash alternatives, I Bond, Inflation, Savings Bond | 53 Comments

Is the Federal Reserve really tightening? So far, not so much.

Quantitative tightening will have to ramp up in coming months if the Fed wants to bring U.S. inflation down.

By David Enna, Tipswatch.com

The basic monetary rule of the last two decades has been this: When the economy slips lower and the stock market stumbles, the Federal Reserve steps in with aggressive stimulus. But when the economy is thriving, and the stock market is soaring, the Fed sits on the sidelines and watches.

That rule has been crushed in 2022, because U.S. inflation has soared to a 41-year high of 9.1%. Now the Fed has been forced to act, and it is aggressively raising interest rates and beginning to reduce its massive balance sheet of Treasurys and mortgage-backed securities.

Amassing the Fed’s current $8.8 trillion balance sheet has taken more than a decade in a process known as quantitative easing. What is quantitative easing? Here is a concise definition from Investopedia:

Quantitative easing (QE) is a form of monetary policy in which a central bank, like the U.S. Federal Reserve, purchases securities from the open market to reduce interest rates and increase the money supply. … As money is increased in an economy, the risk of inflation looms.

When the Fed reduces its balance sheet, it uses a process known as quantitative tightening. Again, here is the Investopia’s concise definition:

Quantitative tightening (QT) refers to monetary policies that contract, or reduce, the Federal Reserve System’s balance sheet. This process is also known as “balance sheet normalization.” In other words, the Fed (or any central bank) shrinks its monetary reserves by either selling Treasuries (government bonds) or by letting them mature and removing them from its cash balances. This removes liquidity, or money, from financial markets.

On March 23, 2022, the Federal Reserve’s balance sheet topped off at $8.96 trillion, an increase of 282% over the total of $2.44 trillion in January 2011. Since March, the Fed has begun to raise interest rates and to allow Treasurys and mortgage-backed securities to mature without reinvestment. Now, as of Aug. 2, 2022, the balance sheet stands at $8.87 trillion, a reduction of just 1% in four months.

I repeat, a reduction of 1% after an increase of 282% over a stretch of 11 years. This is what the Federal Reserve does when it implements quantitative tightening, at least so far into this inflationary crisis. Here is a look back at the Fed’s moves to “ease” and “tighten” over the last 11 years:

Click on the image for a larger version.

There are so many things to consider in this chart.

  • Note that the easing periods — when the Fed was adding to its balance sheet and increasing the U.S. money supply — lasted longer and moved higher very quickly.
  • The Fed increased its balance sheet by 84.8% from January 2011 to November 2014, then essentially kept it stable from 2014 until March 2018.
  • The one period of quantitative tightening that is completed lasted from about March 2018 to September 2019, only 17 months. That 2018-19 tightening resulted in a reduction of only 13.1%.
  • Then in late 2019 through March 2022, the Fed increased its balance sheet by an astounding 138.3%.
  • Now, with tightening beginning again, the Fed is taking a slow-motion approach, reducing the balance sheet only 1% over four months.

Over this same period, here is the trend in the U.S. money supply, as defined by M2:

Click on the image for a larger version.

And to complete the picture, here is the trend in the annual U.S. inflation rate, by month, over that same time period:

Click on the image for a larger version.

Logical conclusion: Increases in the Fed’s balance sheet, especially in the period after 2018 through the pandemic — and combined with aggressive direct-to-taxpayer stimulus from Congress — resulted in a strong surge higher in both money supply and U.S. inflation. To solve today’s dangerous inflation problem, the Fed will have to get serious about reducing its balance sheet, running the risk of weakening the U.S. economy.

But so far, the Fed hasn’t seriously addressed its balance sheet, which has probably resulted in a weird combination of effects: 1) allowing longer-term interest rates to drift lower, and 2) allowing the stock market to surge off its bear market lows.

Barron’s published a story yesterday with a great headline: “The Fed Is About to Ramp Up Balance-Sheet Shrinkage. It May Get Dicey.” The article makes the point that the Fed’s half-hearted balance sheet reduction so far is barely being noticed by the markets. From the article:

When the central bank began QT in June, it set out to partially unwind roughly $4.5 trillion in quantitative easing, or QE, that was conducted in response to the pandemic. The Fed started by letting up to $30 billion in Treasuries and $17.5 billion in mortgage-backed securities, or MBS, roll off its balance sheet, as opposed to reinvesting the proceeds. Starting next month, those caps will rise to $60 billion and $35 billion, respectively, meaning the pace of balance-sheet runoff is about to double. Fed Chairman Jerome Powell has suggested that QT would go on for two to 2½ years, implying that the Fed’s $9 trillion balance sheet would shrink by roughly $2.5 trillion.

Barron’s points out that the Fed has attempted quantitative tightening only once before, in the 2018-19 period, and even though that tightening wasn’t aggressive, it resulted in disruptions to the U.S. bond market. More from the article, with thoughts from Joseph Wang, former senior trader on the Fed’s open markets desk.:

September and beyond is when Wang warns something is apt to break, not unlike what happened the last time the Fed embarked on QT, and chaos in the repo market prompted an early end to the program. …

And from Solomon Tadesse, head of quantitative equities strategies North America at Société Générale:

… in order to bring inflation back to 2%, the Fed needs to shrink its balance sheet by about $3.9 trillion — significantly more than what investors expect, Tadesse says. By his calculations, QT alone would amount to about 4.5 percentage points in additional rate hikes.

“I don’t think there is appreciation for QT, by markets or the Fed,” Tadesse says. “In the end, if QE mattered, so will QT,” he says, referring to the big lift quantitative easing gave to risk assets. “It might not be totally symmetrical, but there will be a meaningful impact.”

The Barron’s article ends with this: “… investors should brace for added volatility. The Fed is entering the unknown, and so are markets.”

Some final thoughts

We have just ended a very strange month for the Treasury and TIPS markets, with uncertainty driving yields higher, lower, higher, lower — almost at random. Much of this volatility followed statements from Jerome Powell, chair of the Federal Reserve, and actions by the European Central Bank. While those statements seemed hawkish to me, the markets reacted with talk that the Fed would soon ease off and begin cutting interest rates again next year.

In his July 27 news conference, Powell said: “We are continuing the process of significantly reducing the size of our balance sheet.” But as the data show, that process has started slowly and has been an insignificant factor, so far, in bond markets. The 10-year Treasury note had a yield of 0.54% on July 1 and closed at 0.37% on Aug. 5.

This isn’t the way it was supposed to work, which forced San Francisco Fed President Mary Daly to step in Tuesday to declare that there is still “a long way to go” to bring inflation down from four-decade highs.

It seems clear to me that if the Fed ever wants to institute quantitative easing again in the future (and you know it will) it has to first drastically reduce its balance sheet, probably down to at least the September 2019 level of $3.8 trillion. That will take a lot of quantitative tightening, over a period of two years, or more.

Unfortunately, that sort of sustained tightening is not likely. And so … inflation will continue to be a problem. And inflation protection continues to make sense as part of your asset allocation.

* * *

Feel free to post comments or questions below. If it is your first-ever comment, it will have to wait for moderation. After that, your comments will automatically appear.

David Enna is a financial journalist, not a financial adviser. He is not selling or profiting from any investment discussed. The investments he discusses can be purchased through the Treasury or other providers without fees, commissions or carrying charges. Please do your own research before investing.

Posted in Federal Reserve, Inflation | 25 Comments

A Greek-Italian restaurant can tell you a lot about real world inflation

By David Enna, Tipswatch.com

Editor’s note: This is an updated version of an article I first wrote in 2017 and revised in 2021.

There’s a restaurant in my hometown – Charlotte, N.C. – that has been in business continuously at the same location on West Morehead Street since 1952. The restaurant business draws a notoriously fickle clientele, so that’s pretty remarkable.

The Open Kitchen was founded by Steve Kokenes, who was Greek, not Italian. His menu of pizza, lasagna, spaghetti and other “international” cuisine was a rarity for Charlotte in those days. The city didn’t get an authentic Italian restaurant – meaning, run by actual Italians – until the late 1980s. But that didn’t matter; the Open Kitchen specialized in simple, tasty comfort food and it prospered.

The restaurant expanded in the 1960s and 1970s. An interesting side note is that its location — once a dreary area of warehouses and factories — is now a booming area of modern apartments, art galleries, trendy breweries and “artisan” restaurants, very close to Bank of America Stadium. It’s now a very valuable piece of property. But the Open Kitchen is still there, still consistently serving “comfort food” to a loyal clientele.

The restaurant is still run by members of the Kokenes family, who wait tables and run the cash register. And they have a remarkable collection of Charlotte memorabilia displayed all over the walls. But what really caught my attention on a past visit was a 1963 menu posted by the entrance to the dining room. It’s especially interesting since today’s menu contains many of the same items – with exactly the same names – 59 years later. Aha! This offers a unique look into inflation over the last 59 years, and … what could be in store for our future.

Full 2022 menu is here.

Where were you 59 years ago?

Back in 1963, $1 was worth … well, one dollar. And that is still true today. But adjusted for inflation (based on the Bureau of Labor Statistics’ Inflation Calculator) it takes $9.68 in today’s dollars (up from $8.89 last year, which is depressing) to equal the buying power of $1 in July 1963. That is an increase of 868%, and it is my baseline for comparisons of price changes from 1963 to today.

Anyone who drove a car before the 1973 gas crisis fondly remembers gasoline at 25 cents a gallon. That’s what it was selling for back in 1963. But in reality, gas prices until a couple years ago were as cheap (relatively speaking) as they were in 1963. However, even after dipping a bit this month, gas prices have almost doubled in the last five years and the cost of gasoline has now surged 1,584% since 1963, much higher than the rate of overall inflation.

And look at the median U.S. home sales price – $402,400 in 2022 – up 22% over the last year and 2,136% since 1963. Home prices have been running well above inflation. Same with the stock market, which has endured four bear markets in the last 22 years and yet is up 4,983% since 1963, nearly six times inflation.

At the same time, the U.S. minimum wage at $7.25 has lagged well behind inflation. At this point, I think, the minimum wage is an archaic idea that should be set to a realistic number ($15 an hour? $18?) and indexed to inflation, or simply abandoned.

The Open Kitchen: Then, and now

I included the Bureau of Labor Statistic’s Food Away From Home index in the chart, which should give you a realistic idea of restaurant price increases over the years. That index was up 7.7% in the last year and 1,105% over the last 59 years.

But the Open Kitchen is an interesting case study. When I did an update to this story last year, many of its prices were still very close to or the same as their 2017 levels. But in 2022, its typical prices have increased at a rate of 11% to 15%, more than the overall restaurant industry. That is realistic since it held prices close to stable from 2017 to 2021.

For example, Spaghetti with Meat Balls and Mushrooms (one of my favorite Open Kitchen offerings) costs $17.25 today versus $1.50 in 1963, a 1,050% increase that is very close to the overall Food At Home index increase of 1,105%. But the price popped up 30% in the last year, bringing it to a more realistic level, I assume.

There are a few bargains on the list: An extra meatball, for example, costs $2.25 today, same as last year, and 800% more than the 1963 cost of 25 cents. That 800% increase is lower than overall U.S. inflation and the Food at Home index. (Waiter: Extra meatball, please!)

Want the more exotic Ravioli Parmigiana? That will cost you 1,140% more than it did in 1963, and probably destroy any hope you had of maintaining your diet. Want half spaghetti, half ravioli? (Good choice.) That will cost you $11.25 and I’d say that’s a bargain, but the price is 1,025% higher than the 1963 cost. So, dang, not really a bargain.

One clear bargain is Spaghetti with Chicken Livers, which now goes for $14.75, versus a rather pricey $1.75 in 1963. That’s an increase of 743%, well below the rate of overall inflation. (This dish is now relegated to very fine print at the bottom of the current menu. Understandable.)

The Open Kitchen also offers a new dish, “Chicken Livers Greque,” with this awesome description:

Plump, juicy chicken livers sauteed in butter, delicately seasoned with oregano and lemon. Served with garden salad and French fries. ($15.50 … <up from $13.50 a year ago>)

I imagine that The Open Kitchen doesn’t sell a lot of Spaghetti with Chicken Livers or Chicken Livers Greque, but it’s a testament to their sense of tradition that they keep these on the menu.

A real world example, in our lifetimes

If you were alive in 1963 — I was 10 years old then — you and I have seen U.S. inflation rise 868% in the last 59 years. Gasoline costs are up more than 1,500%. A typical American home now goes for $402,000 versus $18,000 in 1963.

Inflation is an unrelenting force. I look at today’s Open Kitchen prices and my reaction is “perfectly reasonable.” But imagine if you saw these prices in 1968. You’d have been stunned. Now, imagine the prices you could be seeing in 20, 30, 40 years.

Inflation is dangerous. It’s a force that must be considered.

Another real world example

This week I received my natural gas bill for July. The cost was $91.97, which was 22.6% higher than the July 2021 bill. A year ago, in July 2021, we used more therms (49 vs. 46) and the bill was for more days (34 vs. 32), and even with that … the 2022 bill was 22.6% higher.

This is inflation. I can pay this bill. But a lot of people can’t handle a 22% increase in a basic cost of life.

Note: If you know young people who fail to understand and fear the force of inflation, please share this article with them. This all happened in our lifetimes. It will continue throughout their lifetimes.

* * *

Feel free to post comments or questions below. If it is your first-ever comment, it will have to wait for moderation. After that, your comments will automatically appear.

David Enna is a financial journalist, not a financial adviser. He is not selling or profiting from any investment discussed. The investments he discusses can be purchased through the Treasury or other providers without fees, commissions or carrying charges. Please do your own research before investing.

Posted in Inflation | 17 Comments

Confused by TIPS prices? Here’s a walk-through.

Yes, you can make sense of the complex pricing of Treasury Inflation-Protected Securities.

By David Enna, Tipswatch.com

Last week, I decided to buy $15,000 of the new 10-year Treasury Inflation-Protected Security — CUSIP 91282CEZ0 — being offered at auction by the U.S. Treasury. I was making this purchase in a Vanguard brokerage account (a traditional IRA), where I had set aside $15,095 in cash for the purchase.

The problem was: Would that $15,095 cover the cost, after any premium/discount to par value, plus any additional accrued principal and interest? The Treasury’s official announcement for the auction wasn’t much help, with all the important pricing details to be “Determined at Auction”:

So I did a quick calculation:

  1. I was buying $15,000 of par value.
  2. I knew the real yield to maturity would be at least 0.50%, because that was where the 10-year TIPS market was trading. That would mean the real yield would NOT be below the coupon rate, which only happens when the real yield is less than 0.125%.
  3. Therefore, this TIPS would be sold with at least a slight discount to par.
  4. But … this TIPS would have an inflation index of 1.00495 on the settlement date of July 29, so that would add to my purchased principal, and the cost, along with a small interest adjustment for 14 days of the coupon payment (from the July 15 issue date to the July 29 settlement date).
  5. So, I figured, the highest cost I would end up paying wound be about $15,000 x 1.00495 = $15,074. And I concluded that my $15,095 would cover the cost.

Let’s see what happened

The auction ended up producing a real yield to maturity of 0.630%, which then caused the Treasury to set the coupon rate at 0.625%. When a TIPS has a real yield of 0.125% or higher, the Treasury always sets the coupon rate to the 1/8% below the real yield … 0.125%, 0.250%, 0.375%, o.500%, 0.625% … and so on. A real yield of 0.630% gets a coupon rate of 0.625%, and the price is set at a very small discount to par. A real yield of 0.620% gets a coupon rate of 0.500%, and the price gets a bigger discount.

Here are the auction results, as reported by the Treasury in its official announcement:

So, what does this all mean — high yield, adjusted price, unadjusted price, adjusted accrued interest, index ratio — and how does it affect the price I paid?

The high yield becomes the TIPS’ official real yield to maturity in the auction records. It is the highest yield the Treasury had to grant to complete the $17 billion offering of this TIPS, and it is the real yield granted to all non-competitive bidders (that’s pretty much anyone putting in a purchase order at TreasuryDirect or through a brokerage).

After the auction was completed, Vanguard reported my cost for $15,000 of par value to be $15,070.55. What factors went into setting that price? Once the high yield was set, all the other pricing fell into place Let’s take a look:

Click on the image for a larger version.

The key factor in this chart is the unadjusted price, which was $99.9517 for $100 of par value, and that meant my core cost for the $15,000 in par value was $14,992.75.

But, because of the inflation index of 1.00495, I will be purchasing 14 days of inflation-adjusted additional principal on the settlement date of July 29. That raises my cost to $15,066.97.

In addition, I will have to pay for the 14 days of coupon rate interest that will have accumulated by July 29. Since the coupon rate is 0.625%, 14 days of interest would be about 0.0239%. That is why the adjusted accrued interest is set at $0.239 per $1,000 of par value. Since my accumulated principal will equal about $15,066.87 on July 29, my accrued interest is about $3.60.

And that sets the total cost of the investment: Inflation adjusted value + accrued interest. $15,066.87 + $3.60 = $15,070.57. (OK, Vanguard said it was 2 cents less. I’ll take it. Savings!)

The last line on that chart shows the total value of the investment on July 29, which is simply par value ($15,000) x the inflation index (1.00495) = $15,077.85. In this calculation, I am ignoring the coupon interest which will be paid out as current income twice a year. Also, don’t confuse “total value” with “market value.” Total value reflects only par value + inflation accruals. Market value adds in the fact that the price of a TIPS changes daily on the secondary market. If you are holding to maturity, you can more or less ignore market value.

Happy side note: The inflation index for this TIPS on Aug. 31 will be 1.01939, up 1.3% for the month because of the high rate of non-seasonally adjusted inflation in June. That will put its total value at $15,290.85. Not bad.

Conclusion

I hope this primer on TIPS pricing is helpful. The July 21 auction was an easy one because the real yield ended up just a hair above the coupon rate, making the unadjusted price very close to par. In the last two years that hasn’t be true, with negative real yields far below the lowest possible coupon rate of 0.125%. I am hoping we are entering a new era of positive real yields and much more sensible TIPS pricing.

* * *

Feel free to post comments or questions below. If it is your first-ever comment, it will have to wait for moderation. After that, your comments will automatically appear.

David Enna is a financial journalist, not a financial adviser. He is not selling or profiting from any investment discussed. The investments he discusses can be purchased through the Treasury or other providers without fees, commissions or carrying charges. Please do your own research before investing.

Posted in Investing in TIPS | 68 Comments

New 10-year TIPS gets real yield of 0.630% at auction, a nice result for investors

A weak bid-to-cover ratio of 2.18 indicates lousy demand from big-money investors.

By David Enna, Tipswatch.com

The Treasury’s offering of $17 billion in a new 10-year Treasury Inflation-Protected Security — CUSIP 91282CEZ0 — generated a real yield to maturity of 0.630% at auction Thursday, the highest yield at auction for this term in two years.

The coupon rate was set at 0.625%, the highest coupon for a new TIPS in three years. In fact, this auction broke a string of 15 consecutive auctions of 9- to 10-year TIPS with a coupon rate of 0.125%, the lowest the Treasury will go for a TIPS.

Definition: The “real yield” of a TIPS is its yield above or below official future U.S. inflation, over the term of the TIPS. So a real yield of 0.630% means an investment in this TIPS will exceed U.S. inflation by 0.630% for 10 years.

Investors in today’s auction should be pleased, because a surprise rate hike this morning by the European Central Bank had set both nominal and real yields sliding lower. Nothing drastic, but for much of the morning it looked like this auction’s real yield might dip below 0.60%. The bid-to-cover ratio was 2.18, a very low number and an indication that weak demand forced the real yield higher.

Because the Treasury set the coupon rate at 0.625%, slightly below the auctioned yield, investors paid an unadjusted price of about $99.95 for $100 of par value. However, because this TIPS will have an inflation index of 1.00495 on the settlement date of July 29, the adjusted price was about $100.45 for $100.49 of value, after the inflation accrual is added in.

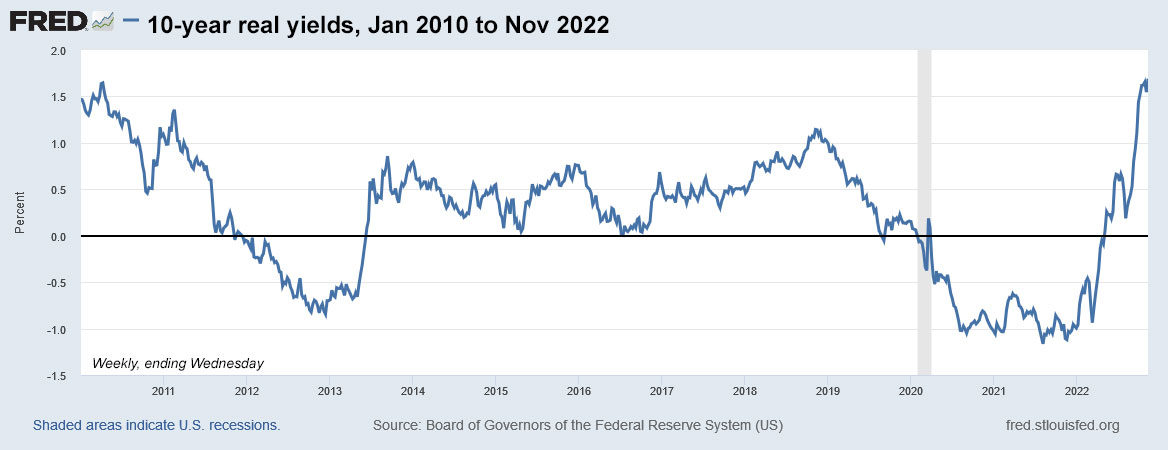
Here is the trend in 10-year real yields in 2022, showing the strong surge higher since the Federal Reserve committed to future rate hikes in March, in an effort to slow soaring U.S. inflation:

Inflation breakeven rate

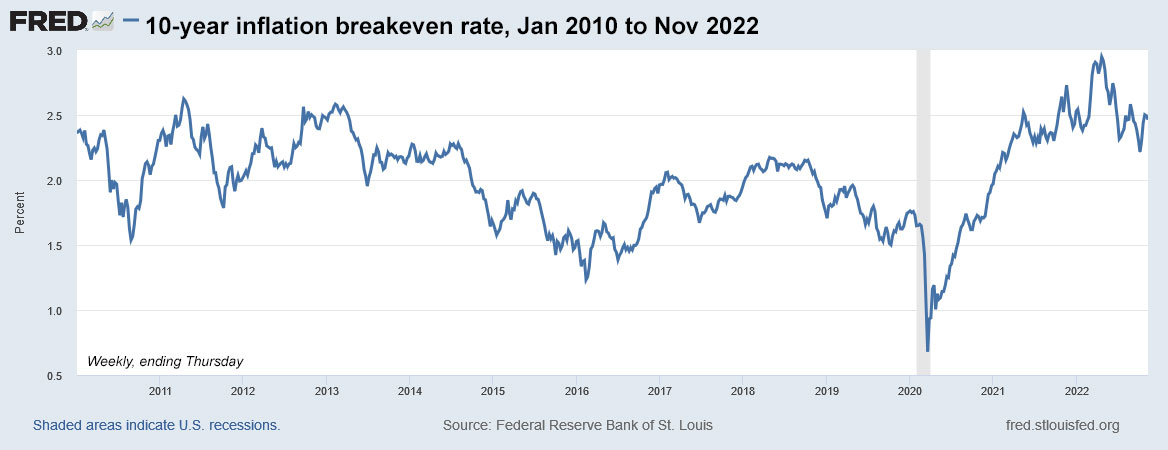
With a 10-year nominal Treasury trading today with a yield of 2.96%, this TIPS gets an inflation breakeven rate of 2.33%, which looks like an attractive number. It means this TIPS will out-perform a nominal Treasury if inflation averages higher than 2.33% over the next 10 years.

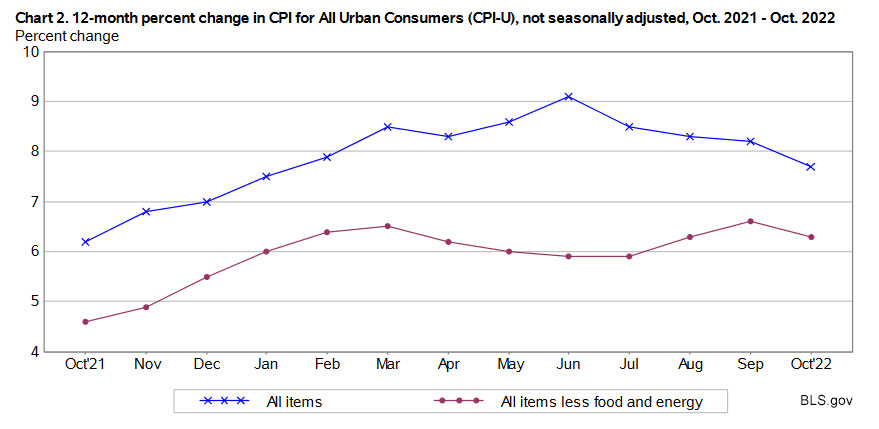
U.S. inflation is currently running at an annual rate of 9.1%. While that number is expected to begin falling in future months, most experts agree it is likely to remain in the 4% to 5% range well into 2023, maybe higher. So again, this auction looks like a positive result for investors.

Here is the trend in the 10-year inflation breakeven rate through 2022, showing how inflation expectations have been falling in reaction to the Federal Reserve’s commitment to fight inflation:

Reaction to this auction

I was a buyer at today’s auction, so I was keeping my eye on TIPS trends through the morning. The European Central Bank’s surprise rate hike (the first in more than 10 years) did appear to roil the bond market, but the moves weren’t dramatic. One effect of the rate hike could be a stronger Euro and weaker dollar, which could slightly elevate inflation in the U.S., but also boost profits of U.S. corporations doing business in Europe.

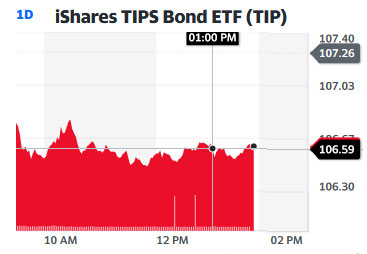
It’s possible big money investors decided to sit this auction out, especially as real yields appeared to be declining through the morning. Bloomberg’s report noted that demand was “soft” at this auction. The bid-to-cover ratio of 2.18 indicates weak demand, which forced the Treasury to accept a higher real yield. But as shown in this chart for the TIP ETF, the market reacted to the auction’s close at 1 p.m. with a yawn. Nothing to see here.

But for buyers at today’s auction, a real yield of 0.630% and a price very close to par is a welcome result. Keep in mind that principal balances for this TIPS will rise 1.37% in August, based on non-seasonally adjusted inflation in June 2022. That’s a darn good first month. (And as a side note, I will point out that the nominal 10-year German bond is currently yielding 1.22% annually, less that the upcoming one-month inflation accrual for this TIPS.)

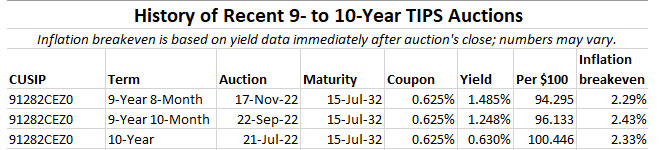
Today’s auction of CUSIP 91282CEZ0 is the first of three for this issue. It will reopened at auctions in September and November. I think there is a reasonable chance yields will be higher at those future auctions, but a lot will depend on the state of the U.S. economy and the Federal Reserve’s commitment to fighting inflation.

Here is a chart of all 9- to 10-year TIPS auctions going back to January 2019, the last auction before the Fed abandoned its tightening policy that began, very slowly, in 2015:

* * *

Feel free to post comments or questions below. If it is your first-ever comment, it will have to wait for moderation. After that, your comments will automatically appear.

David Enna is a financial journalist, not a financial adviser. He is not selling or profiting from any investment discussed. The investments he discusses can be purchased through the Treasury or other providers without fees, commissions or carrying charges. Please do your own research before investing.
Posted in Investing in TIPS | 18 Comments