
My opinion: Long-term investors should buy in October. Short-term term investors could wait until November. But whatever … buy I Bonds in 2021.
By David Enna, Tipswatch.com
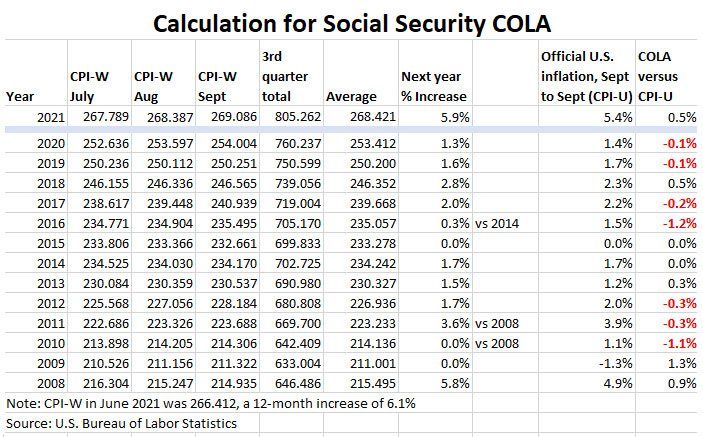
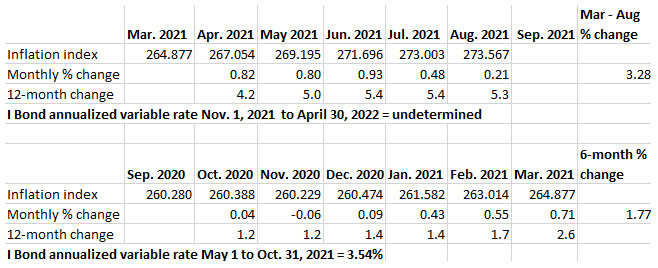
With the release of the September inflation report on Wednesday, we got rather stunning news: All U.S. Series I Savings Bonds will have an inflation-adjusted interest rate of 7.12%, annualized, for six months. That rate will launch immediately for I Bonds purchased in November, or in six months for I Bonds purchased in October.
The key thing is: All I Bond investors will get that 7.12% eventually. But if you purchase an I Bond before the end of October, you will get an annualized return of 3.54% for six months, and then the 7.12% for six months. That adds up to a total return of about 5.33% for the year, a stellar number in our dreary world of ultra-low interest rates.
But the obvious question is: Should you buy in October to lock in that 3.54% rate, or wait until November to start off with a bang at 7.12% for six months? Let’s take a look at the pluses and minuses.
Is this a long-term investment?
Do you plan on holding this I Bond for at least five years, when it can be redeemed without the three-month interest penalty? If so, I think buying in October makes more sense than waiting for November’s higher rate. The reason: We don’t know what the next inflation-adjusted rate will be, the one that will follow 7.12%. It will be based on inflation from September 2021 to March 2022. It could be higher, yes, or it could be lower.
But I can assure you that in the next five years, it is highly likely that you will see an inflation-adjusted rate lower than 3.54%. That rate, based on official U.S. inflation from September 2020 to March 2021, was the I Bond’s highest variable rate in 10 years (dating back to the 4.6% variable rate set in May 2011). Because that 3.54% annualized rate is so attractive in today’s market, I encourage long-term I Bond investors to purchase up to the $10,000 per person cap in October, locking in the 3.54% rate for six months, and then 7.12% for six months.
Conclusion: Long-term I Bond investors should make the purchase in October.
Is this a short-term investment?
A lot of investors are looking at dabbling in I Bonds for the first time as a short-term investment, possibly for a period as short as 11 months. You can purchase an I Bond near the end of a month and get full interest credit for that month. Then, in the same month a year later, you can redeem it, near the beginning of the month. That cuts the required holding period to 11 months and a couple days.
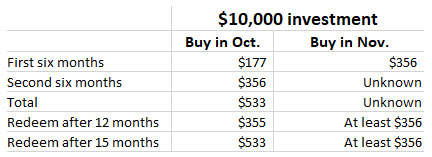
This short-term investment makes a lot of sense in our current market, getting way-above-market returns on an extremely safe investment. And if this is the strategy you are considering, I think buying in November makes a bit more sense than buying in October. If you buy in October and redeem after a year, you will lose three months of interest at the 7.12% level, cutting your total return on a $10,000 investment down to $355. By waiting three months longer, you can boost that return to $533, because the three-month penalty will apply to a potentially lower variable rate.
If you buy in November, your worst case scenario is a return of $356 after 12 months, even if the next variable rate drops to 0.0%. (A three-month penalty on zero interest is zero.) So buying in November, and then redeeming in one year, makes more sense than buying in October.
But let’s take a look at potential inflation scenarios for that next rate reset on May 1, determined by inflation from September 2021 to March 2022. That will give us a more accurate picture of the likely effects of redeeming in either 12 or 15 months. Sorry, but here comes a whole bunch of numbers, with the only changes coming in column 2 for “Buy in November.” If you buy in October, you will know your outcomes for 12 and 15 months, because those rates have been set:
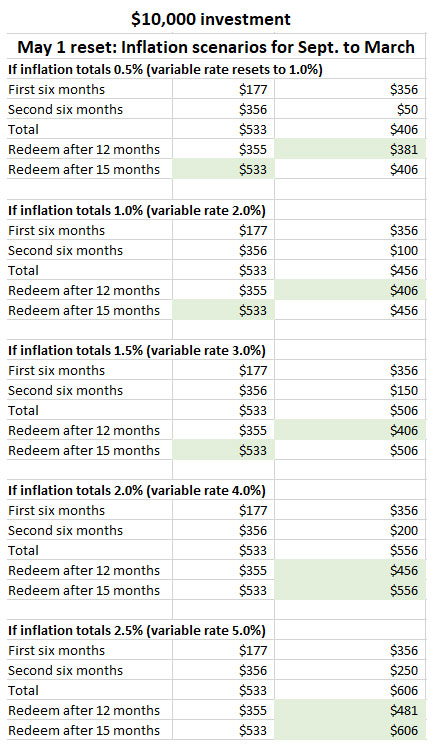
In lower-inflation scenarios, buying in October and holding for 15 months will pay off versus the buy-in-November strategy. But that’s not true after 12 months, because of the high-rate three-month interest penalty imposed on the October purchase. In all scenarios, the November strategy wins for a redemption after 12 months.
I have no idea where inflation will be heading from September to March, but I’d guess it will result in a rate reset of 2.5% to 3.5% in May. The higher the variable rate, the higher the advantage for the November purchase strategy.
Conclusion: If you are planning to buy an I Bond and redeem it in 12 months, then the buy-in-November strategy is the winner. If you might hold for 15 months, though, the advantage only comes with higher inflation in the September to March period.
Do you think the Treasury will increase the I Bond’s fixed rate in November?
I think this is highly unlikely, but anything is possible. The Treasury does weird things, sometimes. What if it suddenly decides to give I Bonds a big boost for small-scale savers? Don’t think that will happen. It’s not at all likely.
Here is a chart showing the real yields of 5- and 10-year Treasury Inflation-Protected Securities at the time of every recent I Bond rate reset where the rate was above 0.0%.
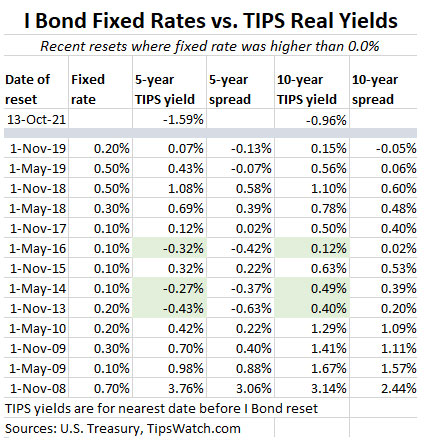
Note that in no case was the yield of a 10-year TIPS below zero when the I Bond fixed rate was set above 0.0%. The current 10-year real yield is -0.96%. The Treasury really doesn’t need to do anything to give I Bonds a boost. They already have a 96-basis-point advantage over a 10-year TIPS.
Conclusion: There’s not much hope the Treasury will raise the I Bond’s fixed rate above 0.0% for the November 1 reset. But if you believe there is a chance, go ahead and wait for the reset and buy in November.
Don’t overthink this …
I actually believe that buying I Bonds in October, and/or buying in November, are both good moves. (I bought my 2021 allocation in January, by the way.) For a long-term investor, buy in October to lock down that 3.54% rate for six months. For a short-term investor, especially one looking to redeem in the shortest time possible, buy in November.
But, whatever you decide: Buy I Bonds in 2021. Can’t go wrong with that decision.
* * *
Feel free to post comments or questions below. If it is your first-ever comment, it will have to wait for moderation. After that, your comments will automatically appear.
David Enna is a financial journalist, not a financial adviser. He is not selling or profiting from any investment discussed. The investments he discusses can purchased through the Treasury or other providers without fees, commissions or carrying charges. Please do your own research before investing.


“So there is a lot of time to ponder a purchase in May or October.” I think you meant to…